 39
39peptides
spectra
0.000 | 0.000
0.072 | 0.077
0.000 | 0.000
0.000 | 0.000
0.048 | 0.052
0.000 | 0.000
0.874 | 0.877
0.000 | 0.000
| Plot | Mito | Lyso | Perox | ER | Golgi | PM | Cytosol | Nucleus | |||||
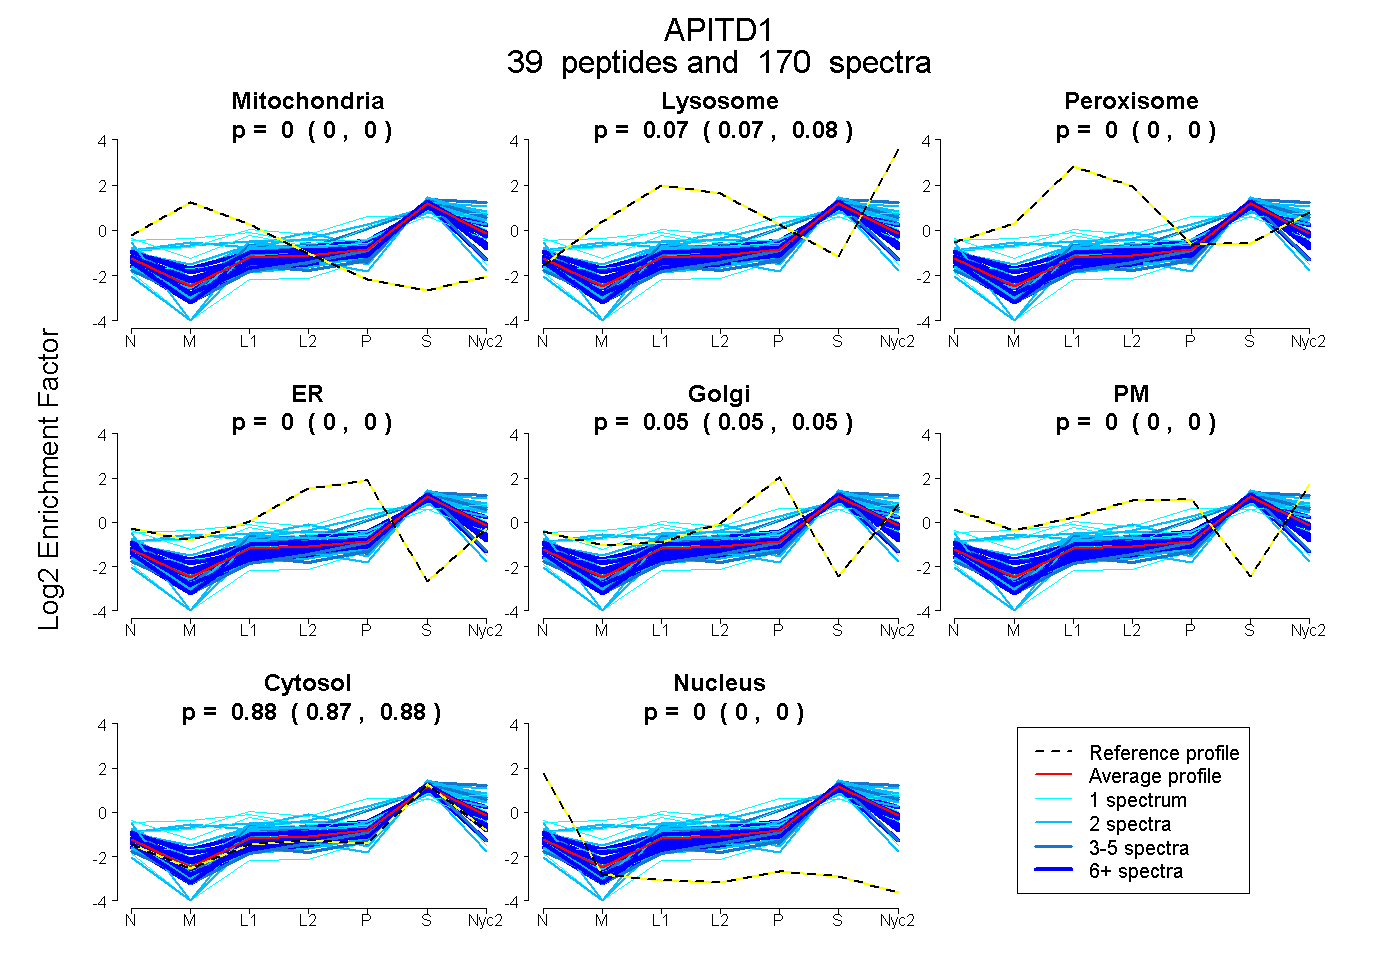
| Expt A |
39 peptides |
170 spectra |
|
0.000 0.000 | 0.000 |
0.075 0.072 | 0.077 |
0.000 0.000 | 0.000 |
0.000 0.000 | 0.000 |
0.050 0.048 | 0.052 |
0.000 0.000 | 0.000 |
0.875 0.874 | 0.877 |
0.000 0.000 | 0.000 |
| 4 spectra, SGLSLEELR | 0.000 | 0.000 | 0.000 | 0.000 | 0.000 | 0.000 | 0.989 | 0.011 | ||
| 7 spectra, EAWPHIK | 0.000 | 0.000 | 0.000 | 0.000 | 0.037 | 0.000 | 0.963 | 0.000 | ||
| 2 spectra, EALLAEMGVAIR | 0.000 | 0.157 | 0.000 | 0.000 | 0.021 | 0.000 | 0.823 | 0.000 | ||
| 6 spectra, SVFLGK | 0.000 | 0.000 | 0.000 | 0.000 | 0.053 | 0.000 | 0.947 | 0.000 | ||
| 3 spectra, DSAGQK | 0.000 | 0.000 | 0.000 | 0.000 | 0.023 | 0.000 | 0.953 | 0.024 | ||
| 2 spectra, IIAELNETWEEK | 0.097 | 0.195 | 0.000 | 0.000 | 0.091 | 0.000 | 0.617 | 0.000 | ||
| 5 spectra, ENLGGNSR | 0.000 | 0.079 | 0.000 | 0.000 | 0.204 | 0.000 | 0.718 | 0.000 | ||
| 14 spectra, HEMLPANLIQAQR | 0.000 | 0.142 | 0.000 | 0.000 | 0.073 | 0.051 | 0.733 | 0.000 | ||
| 6 spectra, YGPSLMPGGNK | 0.000 | 0.109 | 0.000 | 0.000 | 0.051 | 0.014 | 0.827 | 0.000 | ||
| 1 spectrum, HEEMAQAFEDWNK | 0.000 | 0.000 | 0.000 | 0.000 | 0.071 | 0.000 | 0.929 | 0.000 | ||
| 3 spectra, DSVLTWLLR | 0.000 | 0.216 | 0.000 | 0.000 | 0.000 | 0.000 | 0.784 | 0.000 | ||
| 2 spectra, THEDRPFPR | 0.000 | 0.208 | 0.000 | 0.000 | 0.000 | 0.000 | 0.792 | 0.000 | ||
| 6 spectra, FQDTDGK | 0.000 | 0.000 | 0.000 | 0.000 | 0.050 | 0.000 | 0.950 | 0.000 | ||
| 7 spectra, DVLGMR | 0.000 | 0.000 | 0.000 | 0.000 | 0.000 | 0.000 | 1.000 | 0.000 | ||
| 2 spectra, EEHCIFR | 0.068 | 0.000 | 0.246 | 0.000 | 0.083 | 0.000 | 0.603 | 0.000 | ||
| 6 spectra, VILLVK | 0.000 | 0.004 | 0.000 | 0.000 | 0.065 | 0.000 | 0.931 | 0.000 | ||
| 4 spectra, HFLLLR | 0.000 | 0.192 | 0.000 | 0.000 | 0.000 | 0.000 | 0.808 | 0.000 | ||
| 2 spectra, GEENLAGWRPR | 0.000 | 0.205 | 0.000 | 0.000 | 0.000 | 0.000 | 0.795 | 0.000 | ||
| 5 spectra, VGTGEPCCDWVGDEGAGHFVK | 0.000 | 0.000 | 0.000 | 0.000 | 0.000 | 0.000 | 0.965 | 0.035 | ||
| 16 spectra, AGQAVDDFIEK | 0.000 | 0.000 | 0.009 | 0.000 | 0.077 | 0.049 | 0.865 | 0.000 | ||
| 10 spectra, VDDFLAK | 0.000 | 0.000 | 0.000 | 0.000 | 0.019 | 0.000 | 0.962 | 0.018 | ||
| 1 spectrum, SGTLLDGK | 0.000 | 0.251 | 0.099 | 0.000 | 0.217 | 0.000 | 0.433 | 0.000 | ||
| 2 spectra, CLQLLTHTFNR | 0.000 | 0.164 | 0.080 | 0.000 | 0.000 | 0.000 | 0.756 | 0.000 | ||
| 12 spectra, MVQLEGSK | 0.000 | 0.065 | 0.000 | 0.000 | 0.037 | 0.017 | 0.882 | 0.000 | ||
| 2 spectra, LELLHEVEK | 0.000 | 0.025 | 0.000 | 0.000 | 0.000 | 0.000 | 0.975 | 0.000 | ||
| 2 spectra, ELVVGR | 0.000 | 0.210 | 0.000 | 0.000 | 0.000 | 0.000 | 0.790 | 0.000 | ||
| 6 spectra, TIFQAIAAK | 0.000 | 0.025 | 0.000 | 0.000 | 0.000 | 0.125 | 0.850 | 0.000 | ||
| 1 spectrum, DVLMGR | 0.000 | 0.000 | 0.000 | 0.000 | 0.000 | 0.000 | 0.934 | 0.066 | ||
| 3 spectra, GILFVGSGVSGGEEGAR | 0.000 | 0.023 | 0.000 | 0.000 | 0.000 | 0.000 | 0.977 | 0.000 | ||
| 3 spectra, MNDLDLK | 0.000 | 0.152 | 0.000 | 0.000 | 0.000 | 0.000 | 0.848 | 0.000 | ||
| 2 spectra, GGCIIR | 0.149 | 0.000 | 0.049 | 0.026 | 0.000 | 0.000 | 0.775 | 0.000 | ||
| 12 spectra, SAVDDCQDSWR | 0.000 | 0.000 | 0.000 | 0.041 | 0.007 | 0.000 | 0.907 | 0.044 | ||
| 2 spectra, QAFLEDVR | 0.000 | 0.000 | 0.000 | 0.000 | 0.000 | 0.000 | 0.999 | 0.001 | ||
| 2 spectra, VAHPVQLR | 0.000 | 0.013 | 0.000 | 0.000 | 0.159 | 0.094 | 0.733 | 0.000 | ||
| 2 spectra, IISYAQGFMLLR | 0.000 | 0.094 | 0.000 | 0.000 | 0.000 | 0.105 | 0.802 | 0.000 | ||
| 2 spectra, IMSTPGGEEAIER | 0.000 | 0.199 | 0.000 | 0.000 | 0.000 | 0.000 | 0.801 | 0.000 | ||
| 1 spectrum, NPELQNLLLDDFFK | 0.000 | 0.000 | 0.000 | 0.035 | 0.183 | 0.000 | 0.782 | 0.000 | ||
| 1 spectrum, TVVAVEVQDLK | 0.122 | 0.000 | 0.278 | 0.000 | 0.106 | 0.000 | 0.493 | 0.000 | ||
| 1 spectrum, LAVTSYTDIADLMDAGNK | 0.000 | 0.096 | 0.122 | 0.000 | 0.000 | 0.154 | 0.628 | 0.000 |
| Plot | Mito | Lyso or Perox | ER | Golgi | PM | Cytosol | Nucleus | ||||||
| Expt B |
12 peptides |
33 spectra |
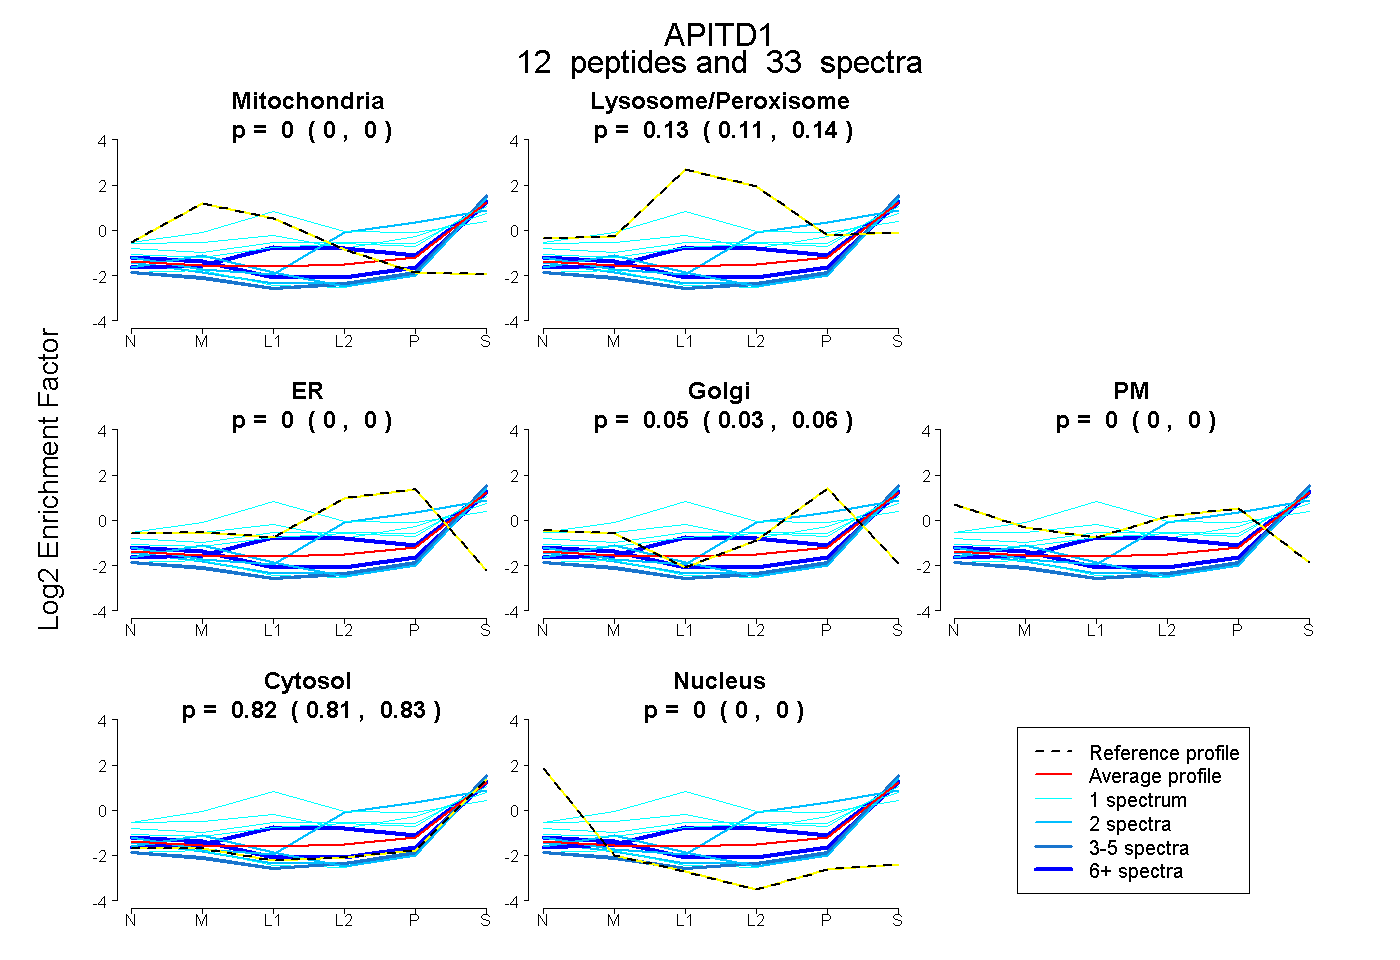 |
0.000 0.000 | 0.000 |
0.128 0.111 | 0.141 |
0.000 0.000 | 0.000 |
0.050 0.033 | 0.063 |
0.000 0.000 | 0.000 |
0.823 0.809 | 0.835 |
0.000 0.000 | 0.000 |
|||
| Plot | Lyso | Other | |||||||||||
| Expt C |
29 peptides |
143 spectra |
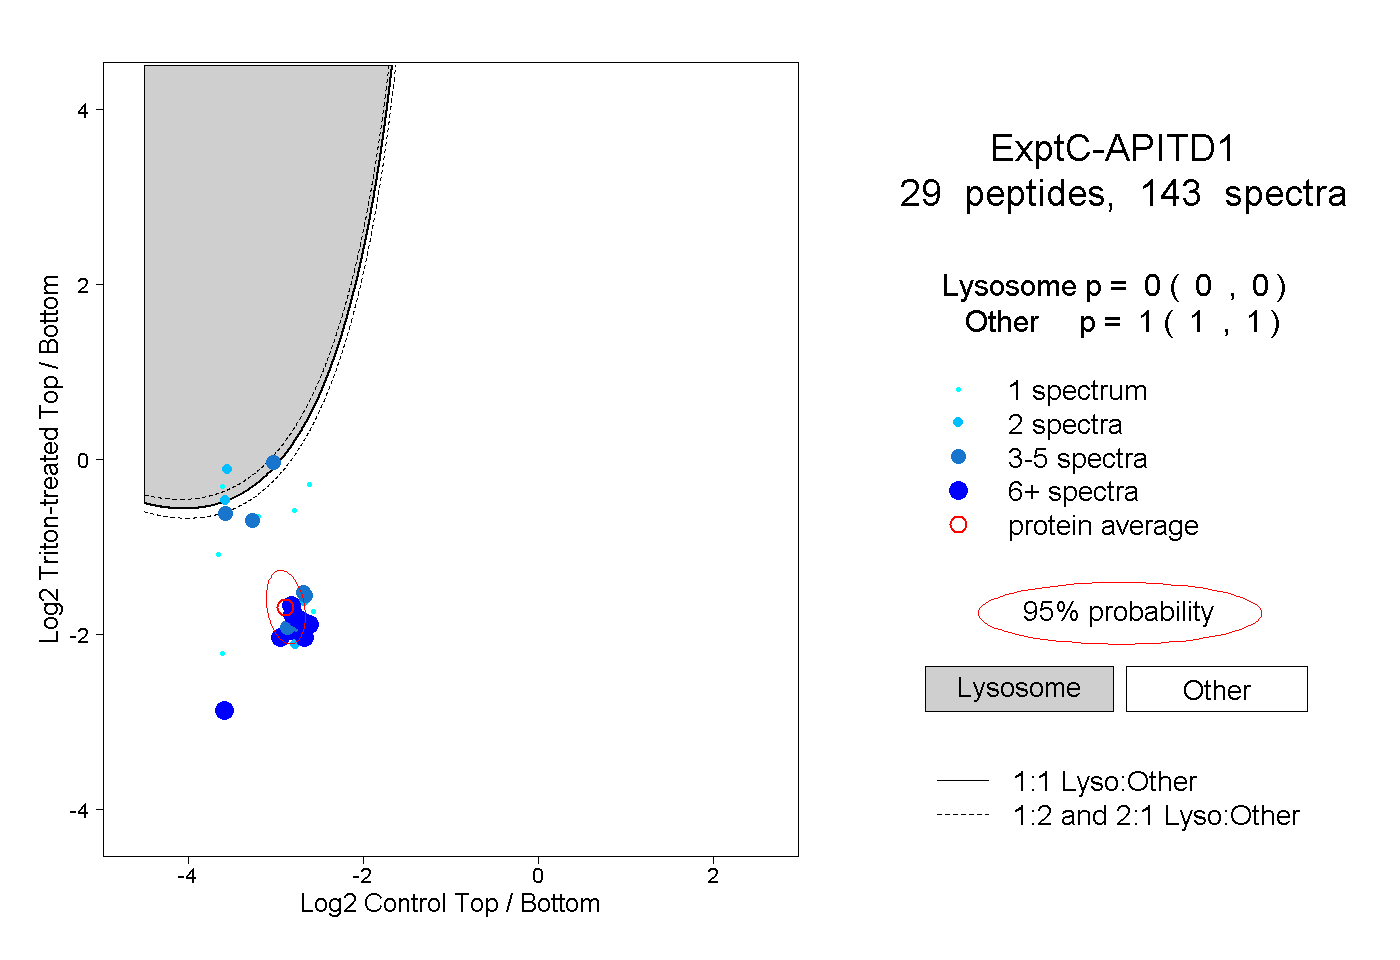 |
0.000 0.000 | 0.000 |
1.000 1.000 | 1.000 |
||||||||
| Plot | Lyso | Other | |||||||||||
| Expt D |
7 peptides |
12 spectra |
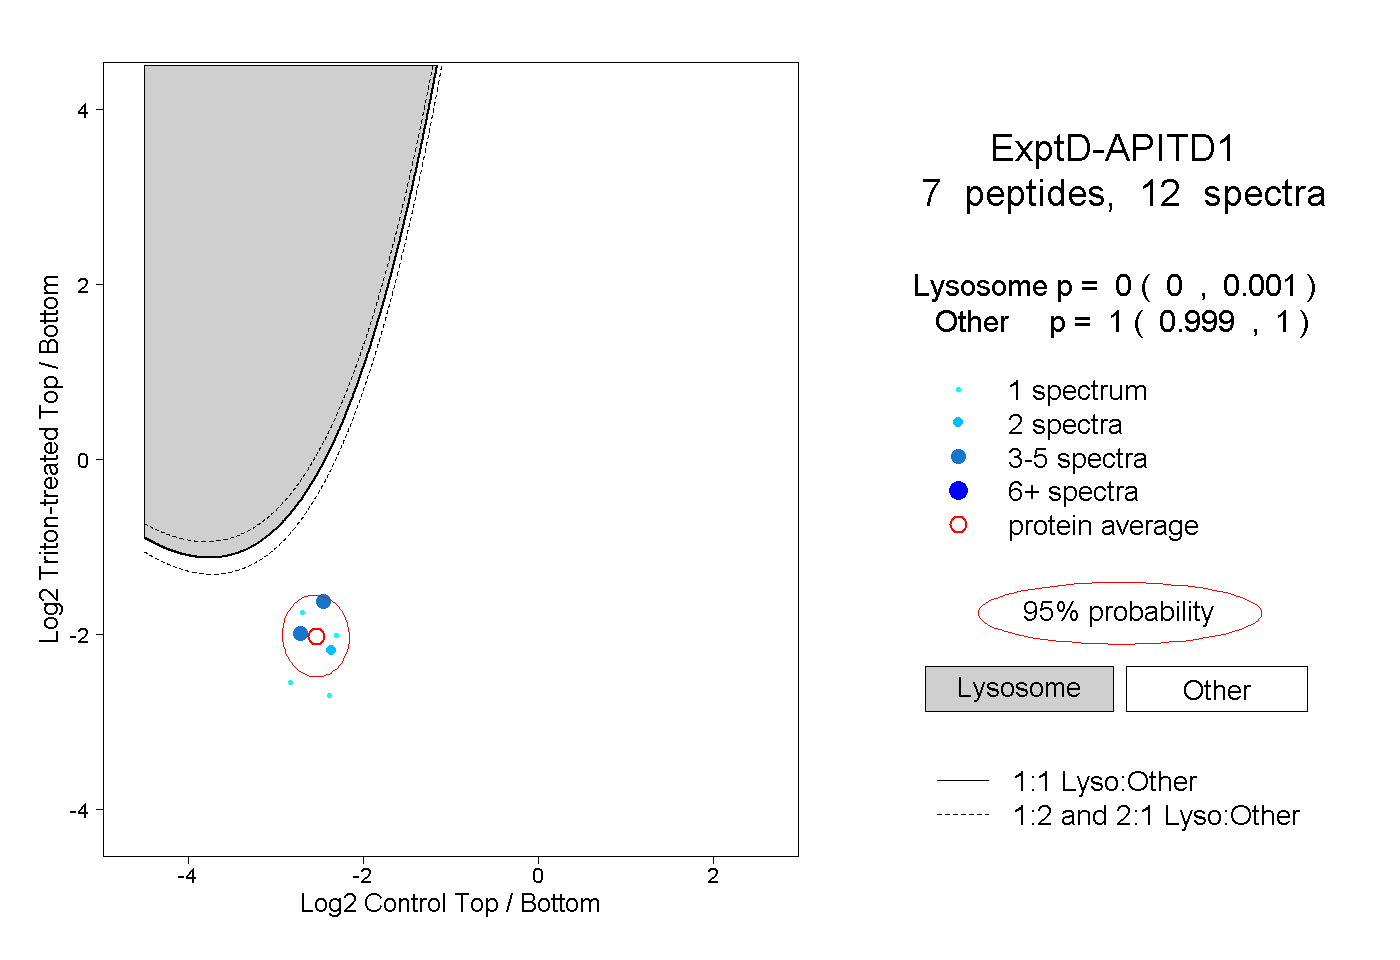 |
0.000 0.000 | 0.001 |
1.000 0.999 | 1.000 |