 39
39peptides
spectra
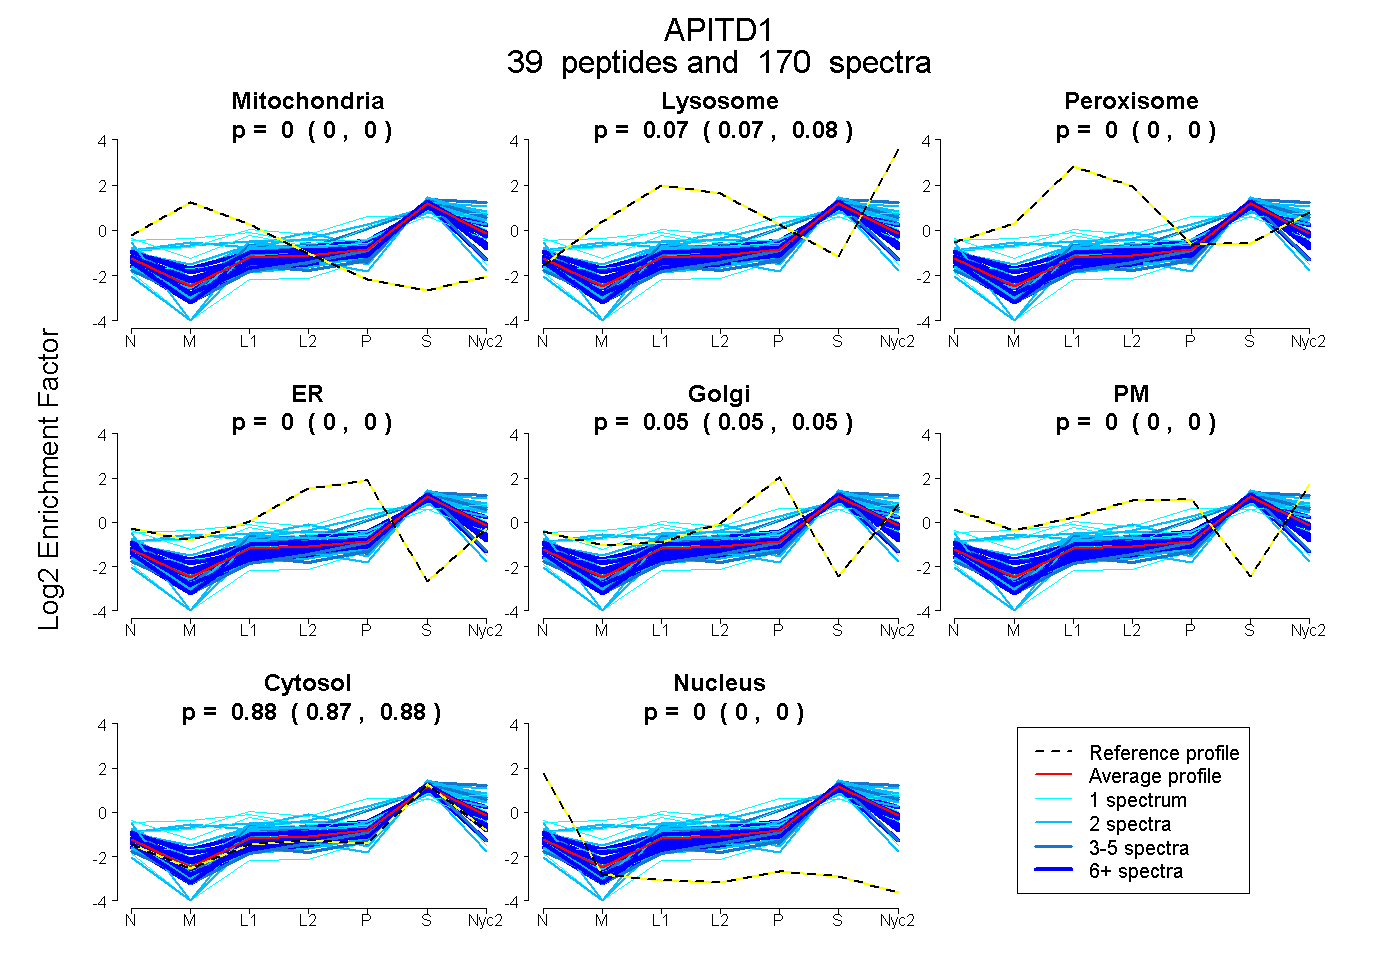
0.000 | 0.000
0.072 | 0.077
0.000 | 0.000
0.000 | 0.000
0.048 | 0.052
0.000 | 0.000
0.874 | 0.877
0.000 | 0.000
12peptides
spectra
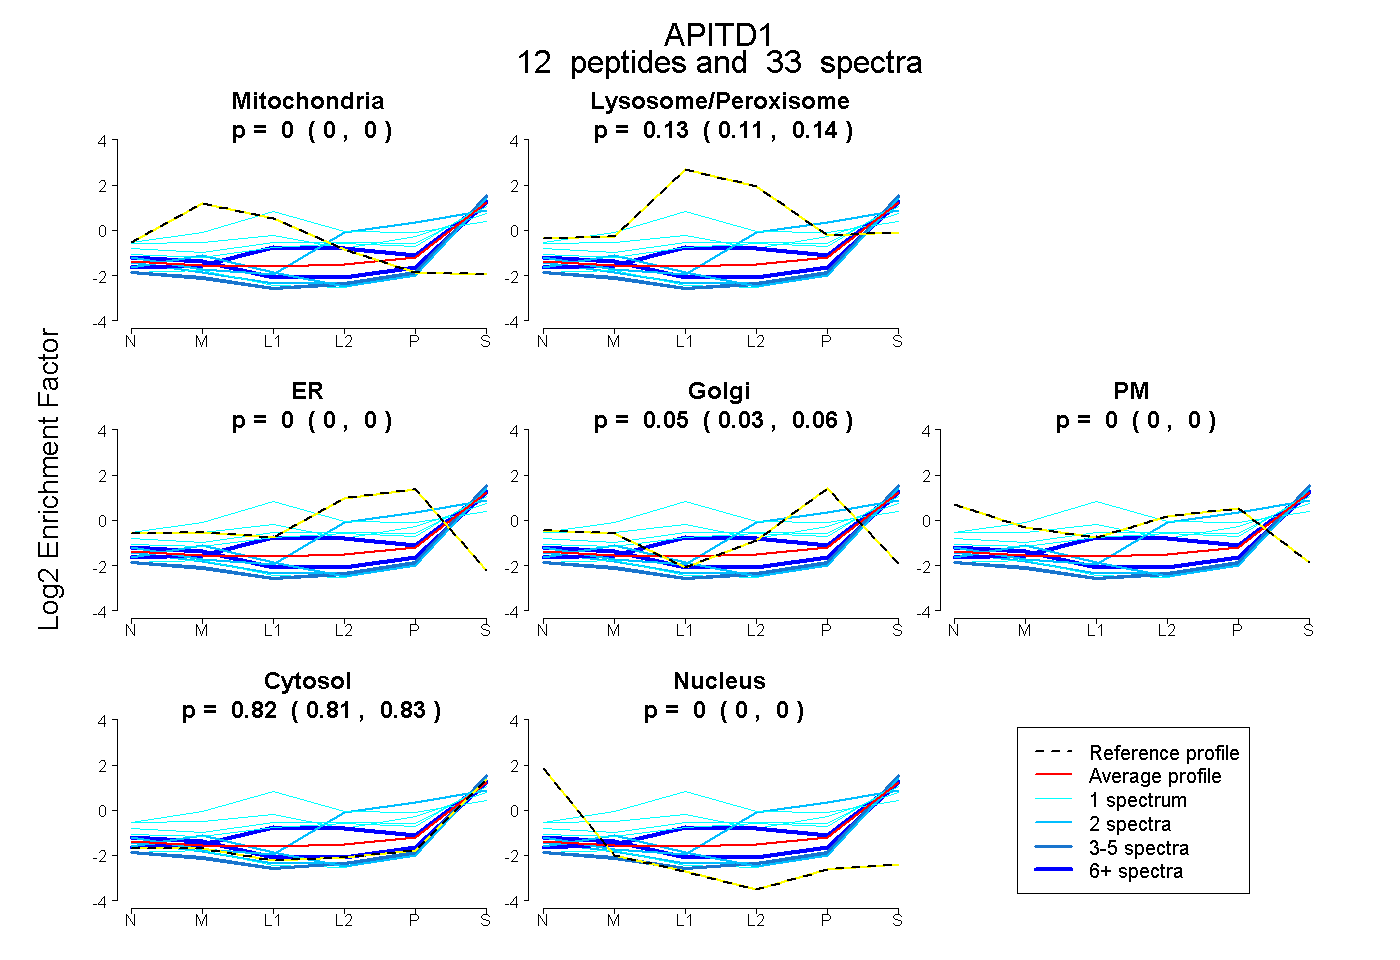
0.000 | 0.000
0.111 | 0.141
0.000 | 0.000
0.033 | 0.063
0.000 | 0.000
0.809 | 0.835
0.000 | 0.000
29peptides
spectra
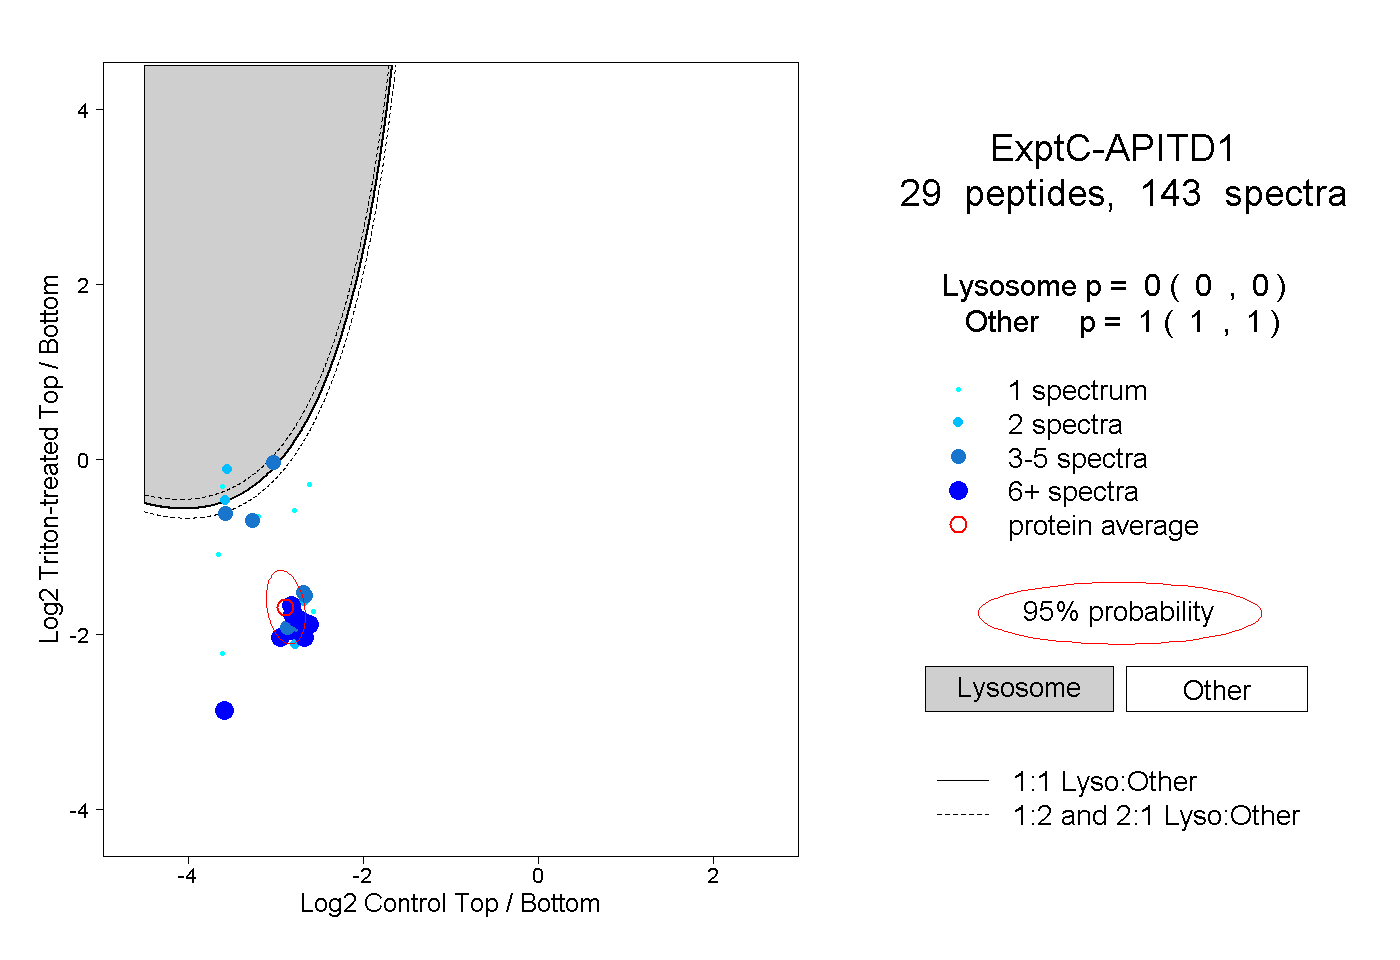
0.000 | 0.000
1.000 | 1.000
7peptides
spectra
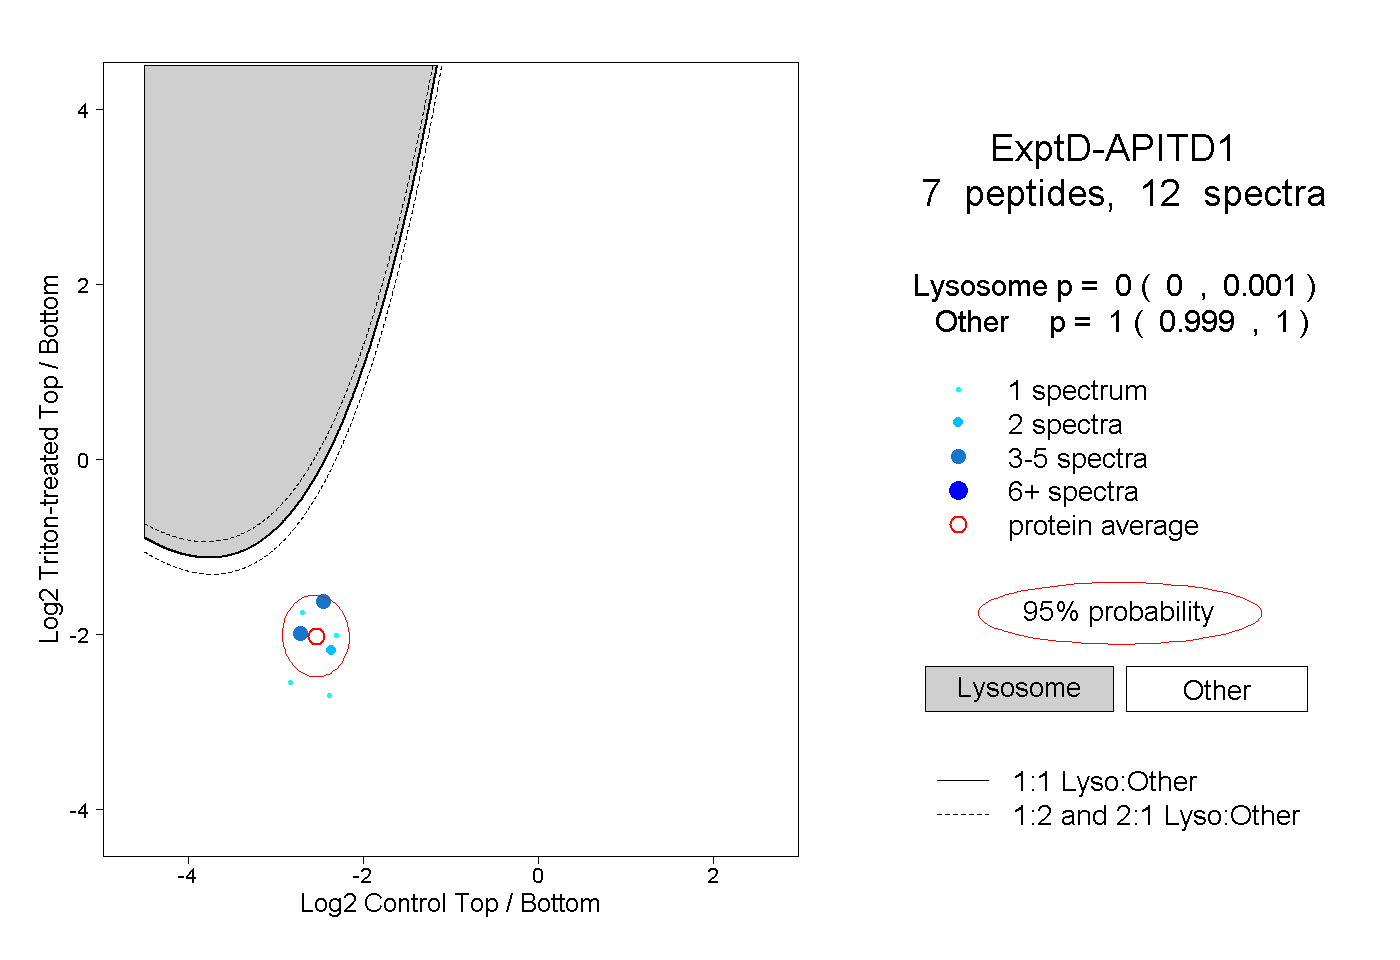
0.000 | 0.001
0.999 | 1.000