 2
2peptides
spectra
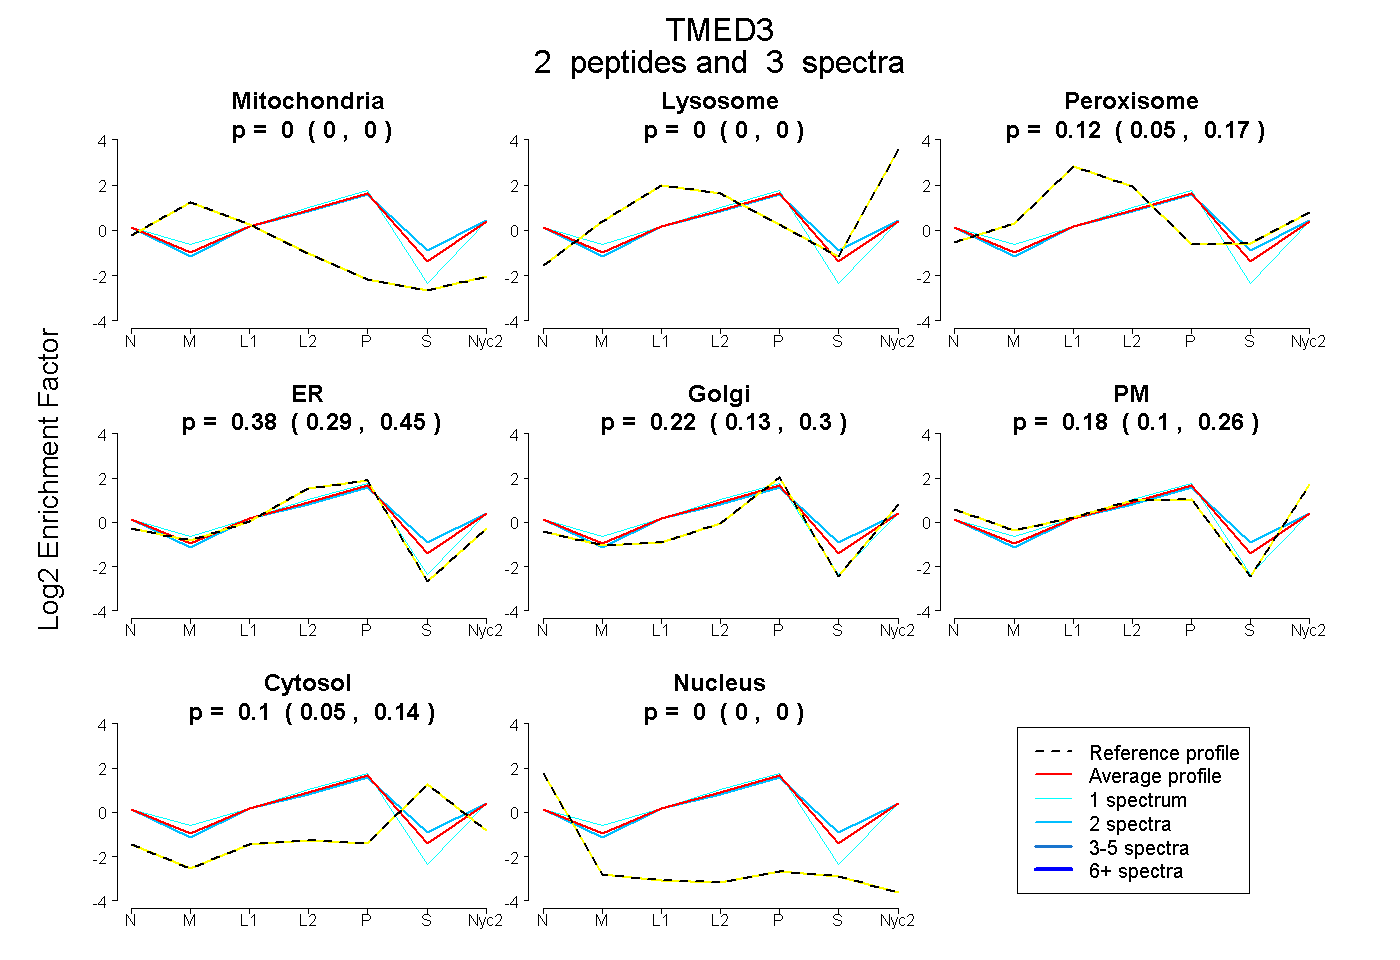
0.000 | 0.000
0.000 | 0.000
0.046 | 0.173
0.293 | 0.451
0.129 | 0.297
0.100 | 0.256
0.052 | 0.138
0.000 | 0.000
| Plot | Mito | Lyso | Perox | ER | Golgi | PM | Cytosol | Nucleus | |||||
| Expt A |
2 peptides |
3 spectra |
|
0.000 0.000 | 0.000 |
0.000 0.000 | 0.000 |
0.117 0.046 | 0.173 |
0.376 0.293 | 0.451 |
0.225 0.129 | 0.297 |
0.183 0.100 | 0.256 |
0.100 0.052 | 0.138 |
0.000 0.000 | 0.000 |
| 2 spectra, AEDLNSR | 0.000 | 0.000 | 0.144 | 0.313 | 0.234 | 0.153 | 0.156 | 0.000 | ||
| 1 spectrum, QCFHEEVEQGVK | 0.000 | 0.000 | 0.046 | 0.517 | 0.165 | 0.270 | 0.000 | 0.002 |
| Plot | Lyso | Other | |||||||||||
| Expt C |
3 peptides |
6 spectra |
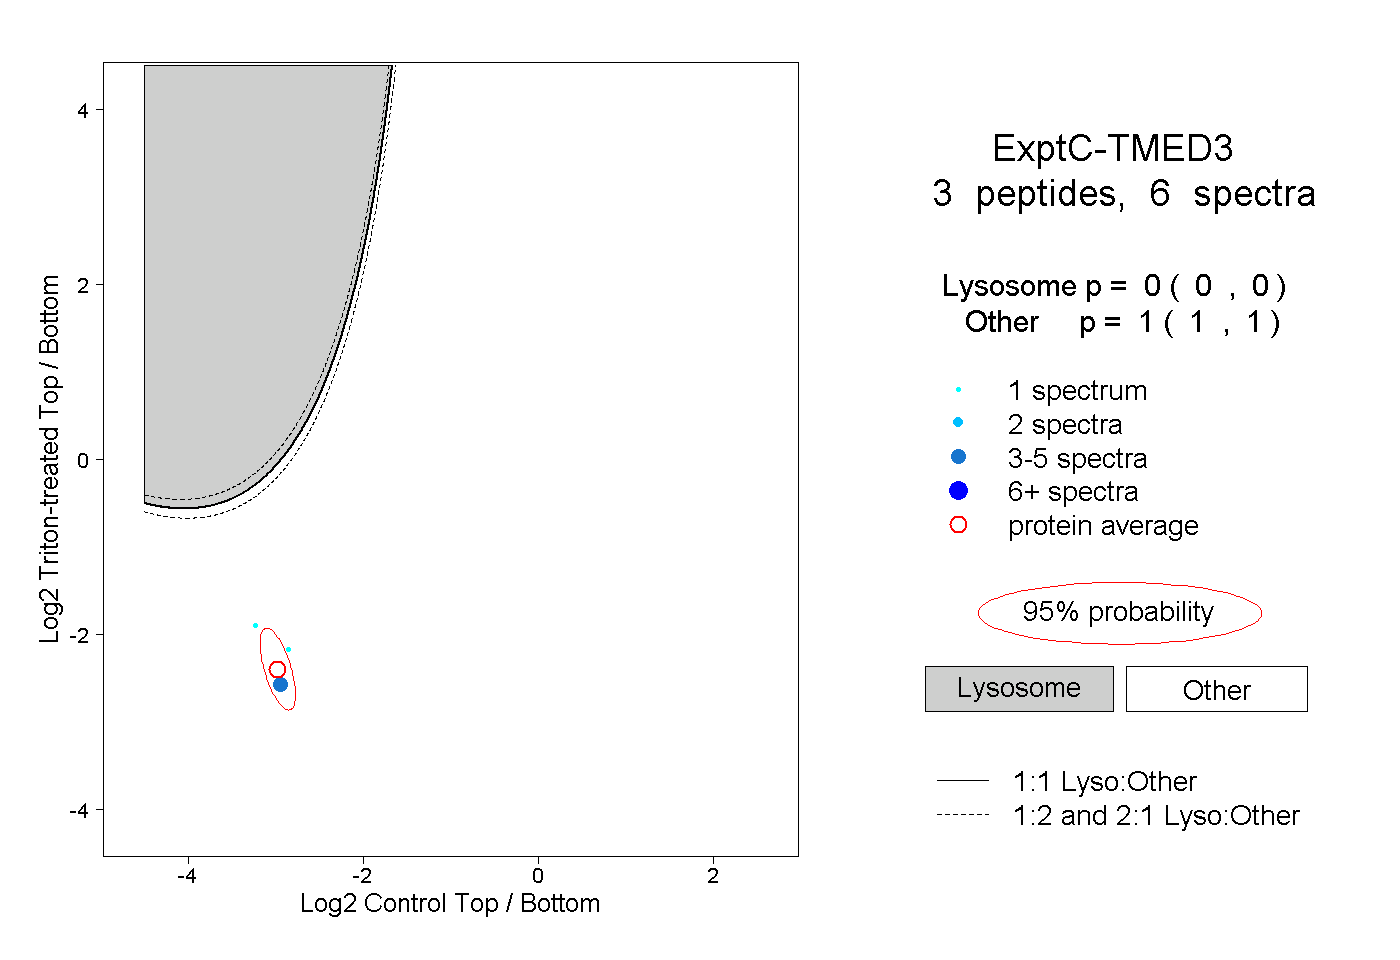 |
0.000 0.000 | 0.000 |
1.000 1.000 | 1.000 |