ARCN1
[ENSRNOP00000018598]
Main page
| | | Plot |
Mito |
Lyso |
|
Perox |
ER |
Golgi |
PM |
Cytosol |
Nucleus |
|
| Expt A |
 21
21
peptides |
85
spectra |
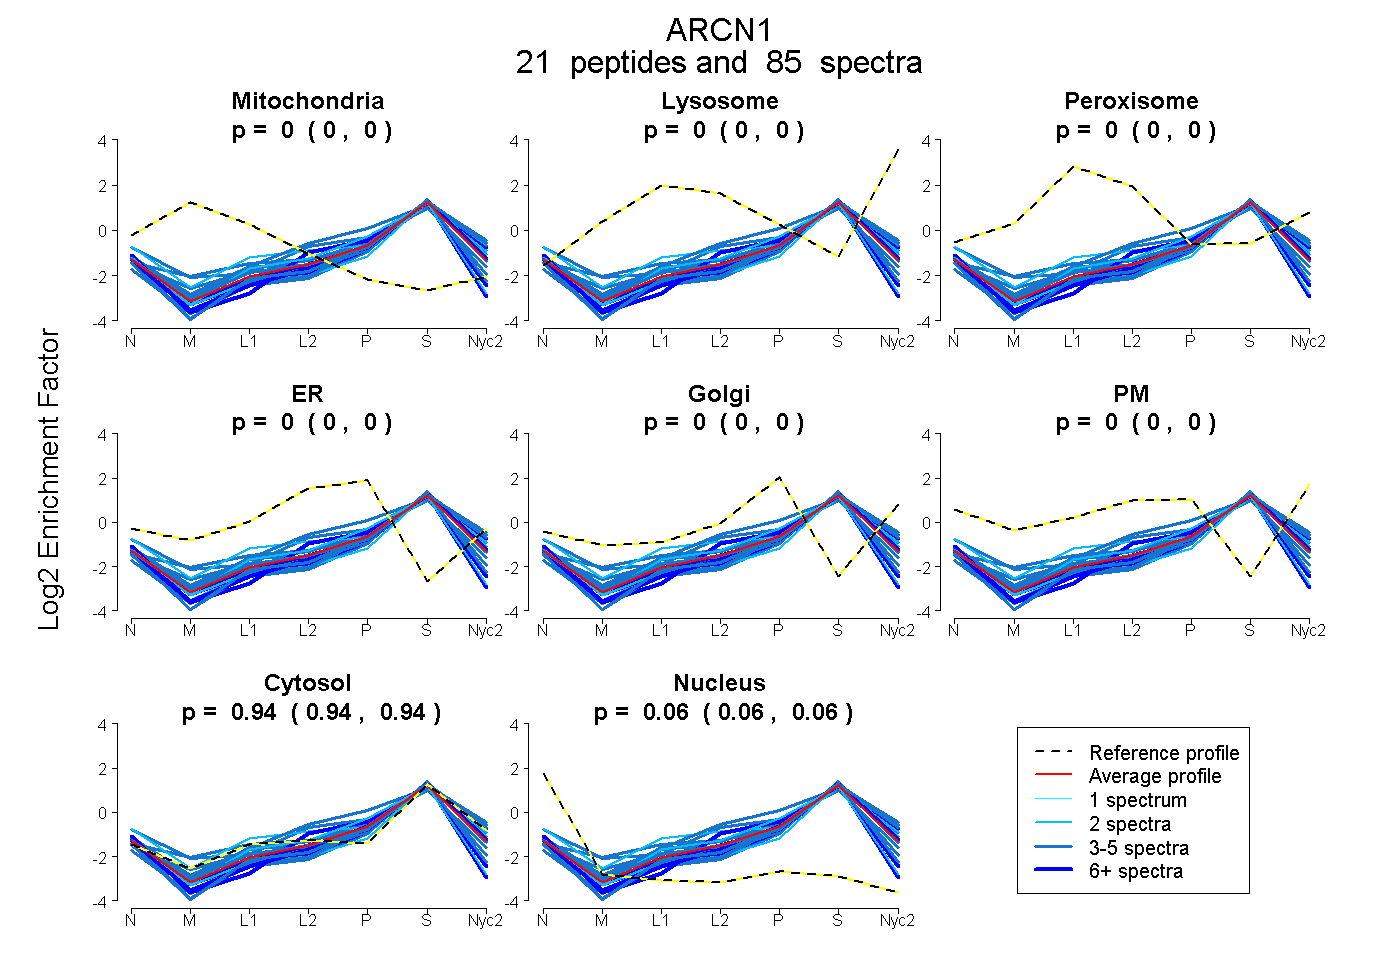 |
0.000
0.000 | 0.000 |
0.000
0.000 | 0.000 |
|
0.000
0.000 | 0.000 |
0.000
0.000 | 0.000 |
0.001
0.000 | 0.003 |
0.000
0.000 | 0.000 |
0.939
0.936 | 0.940 |
0.061
0.058 | 0.063 |
|
| | | Plot |
Mito |
|
Lyso or Perox |
|
ER |
Golgi |
PM |
Cytosol |
Nucleus |
|
| Expt B |
10
peptides |
22
spectra |
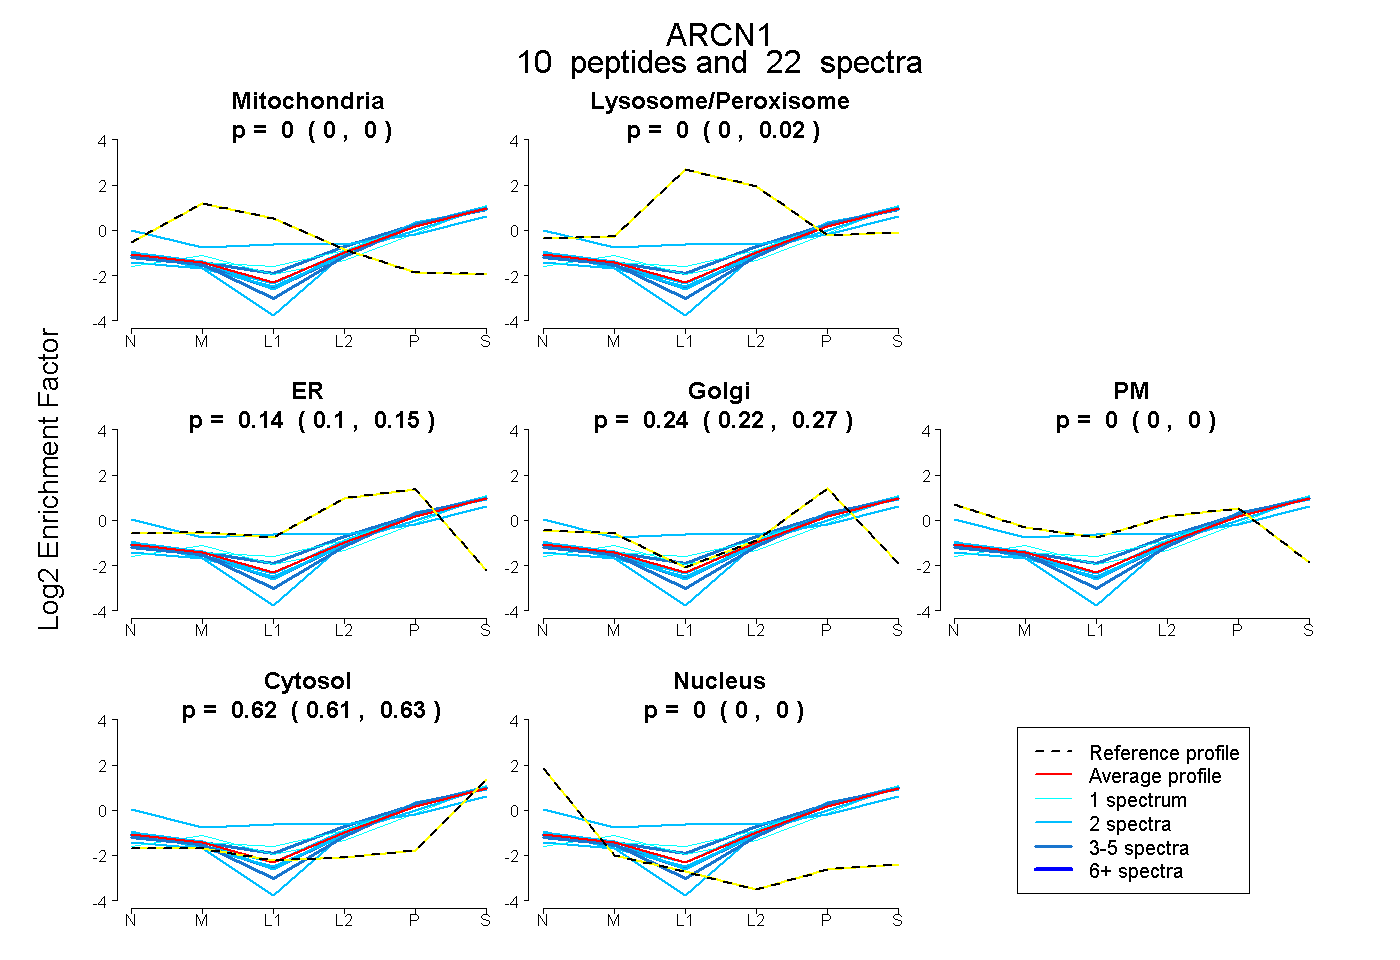 |
0.000
0.000 | 0.000 |
|
0.000
0.000 | 0.020 |
|
0.138
0.097 | 0.151 |
0.240
0.219 | 0.272 |
0.000
0.000 | 0.000 |
0.622
0.609 | 0.626 |
0.000
0.000 | 0.000 |
|
| 2 spectra, LFTAESLIGLK |
0.000 |
|
0.000 |
|
0.000 |
0.356 |
0.000 |
0.644 |
0.000 |
|
| 1 spectrum, SFPVNSDVGVLK |
0.000 |
|
0.148 |
|
0.000 |
0.305 |
0.000 |
0.547 |
0.000 |
|
| 2 spectra, QHTFVETESVR |
0.000 |
|
0.217 |
|
0.000 |
0.000 |
0.347 |
0.436 |
0.000 |
|
| 2 spectra, VLLAAAVCTK |
0.000 |
|
0.000 |
|
0.065 |
0.296 |
0.000 |
0.639 |
0.000 |
|
| 4 spectra, VTQVDGNSPVR |
0.000 |
|
0.000 |
|
0.000 |
0.386 |
0.000 |
0.614 |
0.000 |
|
| 2 spectra, ENVNLAQIR |
0.000 |
|
0.000 |
|
0.145 |
0.248 |
0.000 |
0.607 |
0.000 |
|
| 3 spectra, ITLTCGR |
0.000 |
|
0.000 |
|
0.030 |
0.349 |
0.000 |
0.621 |
0.000 |
|
| 2 spectra, VIPEYCR |
0.000 |
|
0.000 |
|
0.027 |
0.376 |
0.000 |
0.597 |
0.000 |
|
| 3 spectra, NSNILEDLETLR |
0.000 |
|
0.050 |
|
0.207 |
0.150 |
0.000 |
0.593 |
0.000 |
|
| 1 spectrum, QFVEMTR |
0.000 |
|
0.068 |
|
0.000 |
0.256 |
0.000 |
0.676 |
0.000 |
|
| | | Plot |
|
Lyso |
|
|
|
|
|
|
|
Other |
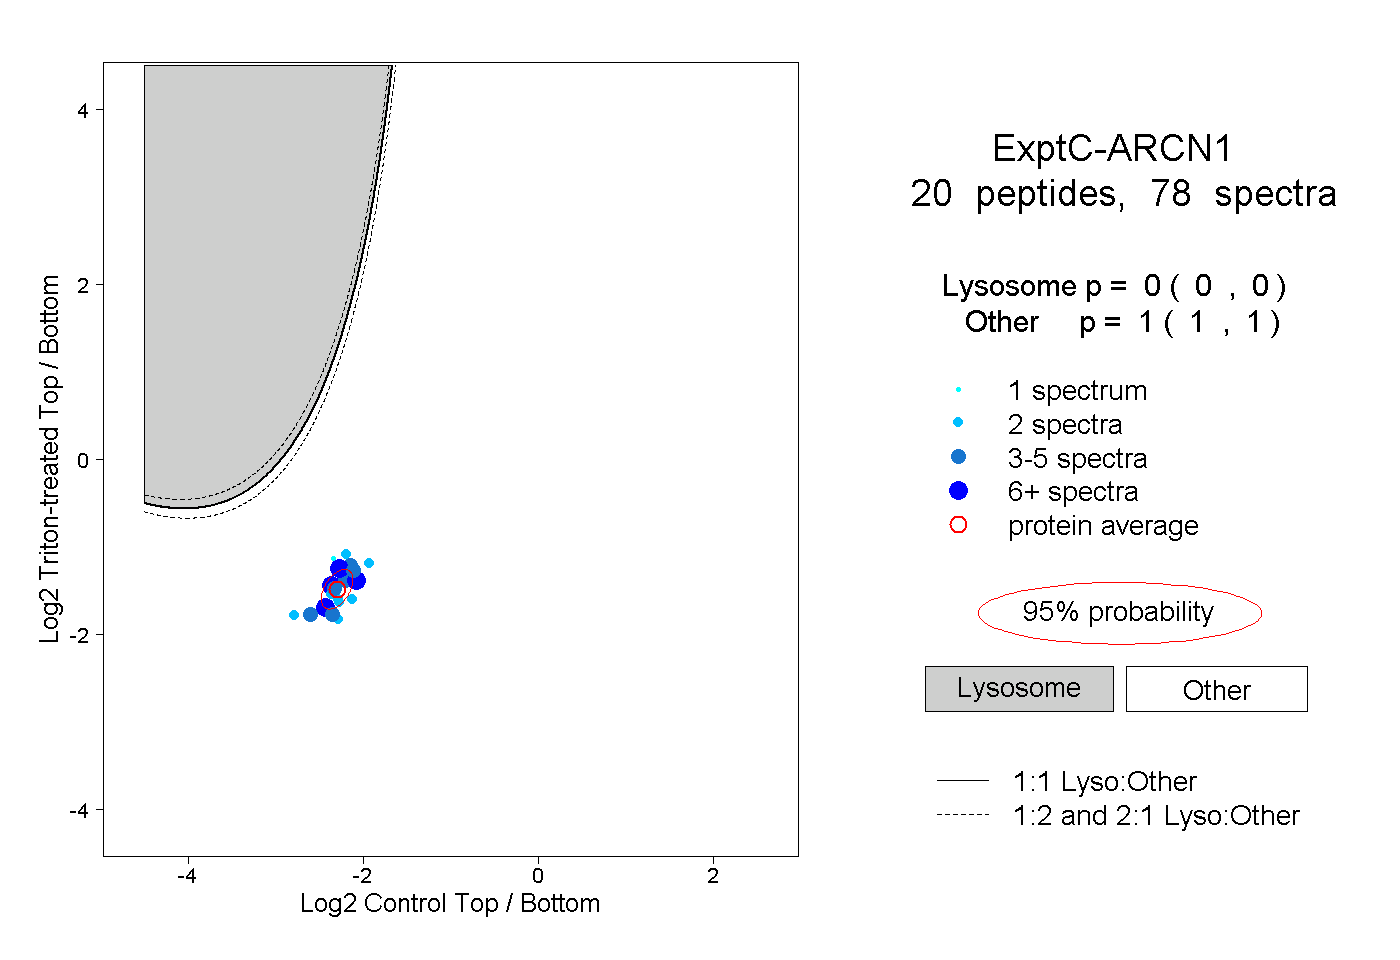
| Expt C |
20
peptides |
78
spectra |
 |
|
0.000
0.000 | 0.000 |
|
|
|
|
|
|
|
1.000
1.000 | 1.000 |
| | | Plot |
|
Lyso |
|
|
|
|
|
|
|
Other |
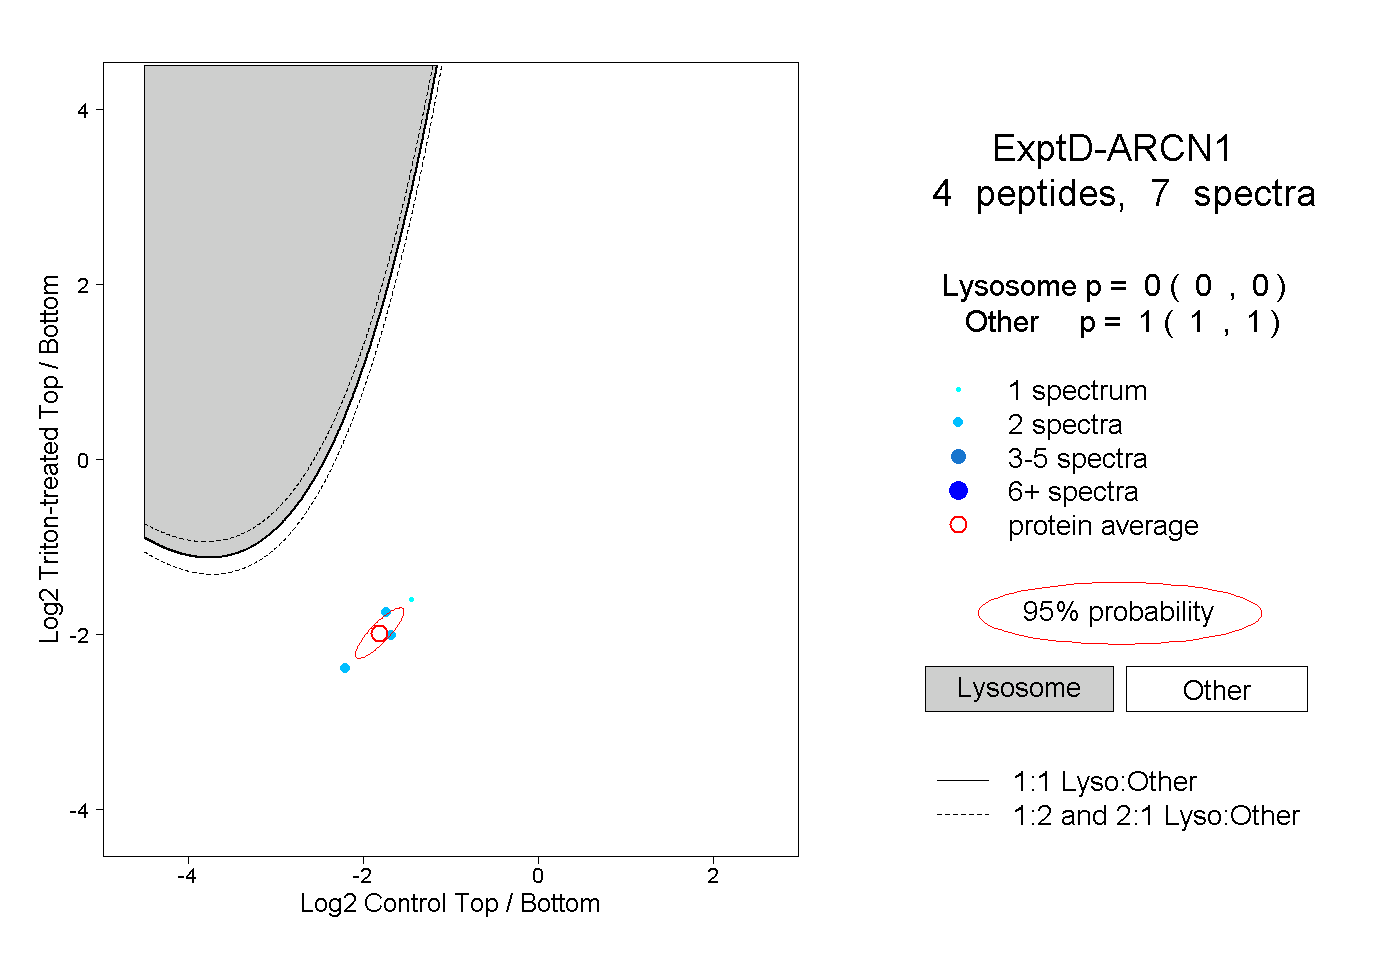
| Expt D |
4
peptides |
7
spectra |
 |
|
0.000
0.000 | 0.000 |
|
|
|
|
|
|
|
1.000
1.000 | 1.000 |