 21
21peptides
spectra
0.000 | 0.000
0.000 | 0.000
0.000 | 0.000
0.000 | 0.000
0.000 | 0.003
0.000 | 0.000
0.936 | 0.940
0.058 | 0.063
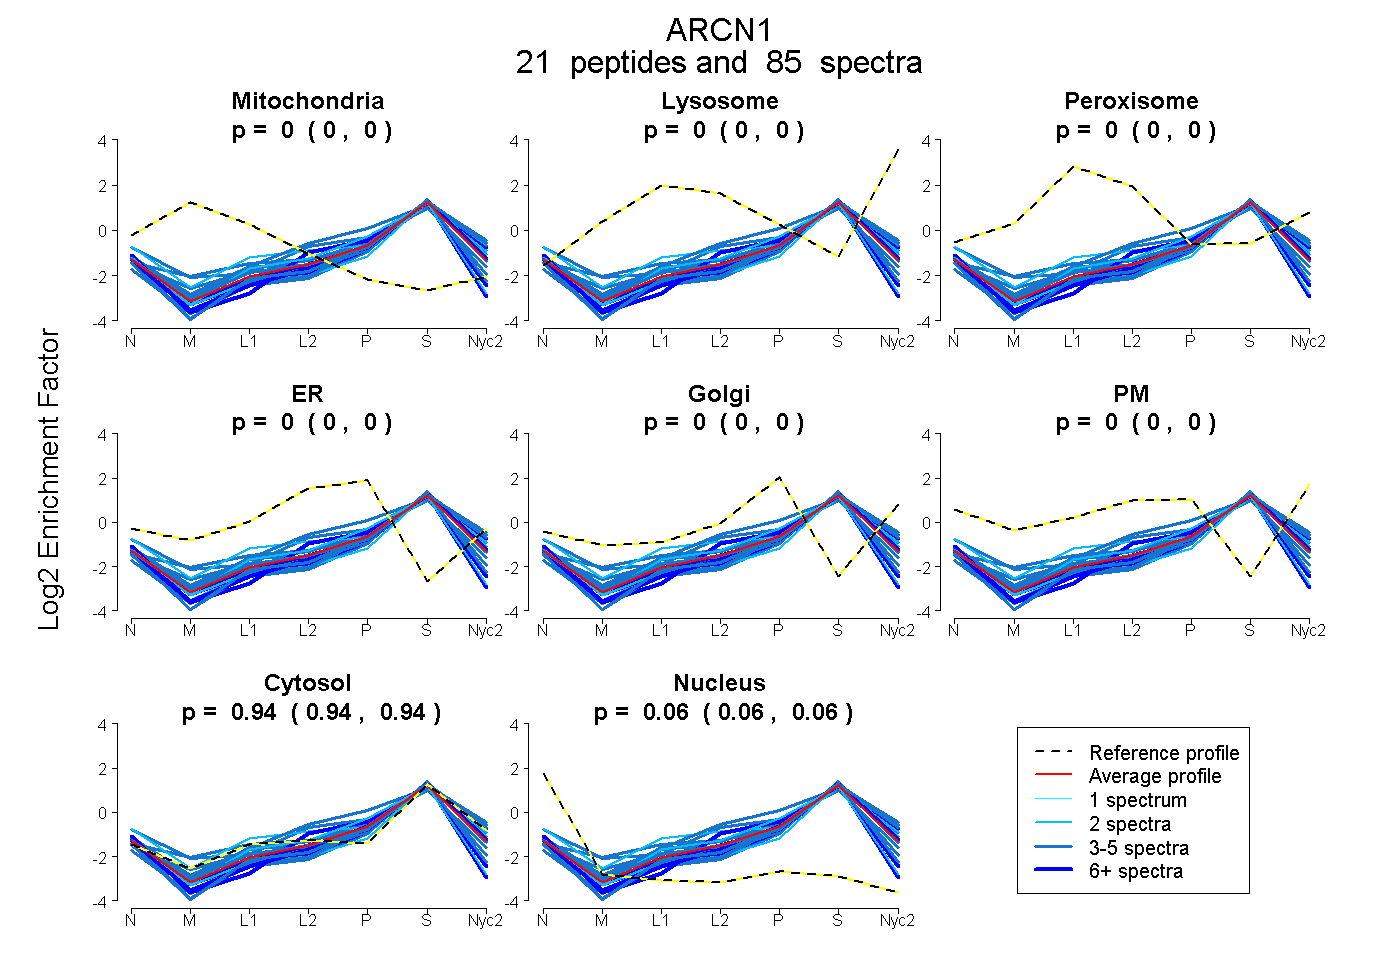
| Plot | Mito | Lyso | Perox | ER | Golgi | PM | Cytosol | Nucleus | |||||
| Expt A |
21 peptides |
85 spectra |
|
0.000 0.000 | 0.000 |
0.000 0.000 | 0.000 |
0.000 0.000 | 0.000 |
0.000 0.000 | 0.000 |
0.001 0.000 | 0.003 |
0.000 0.000 | 0.000 |
0.939 0.936 | 0.940 |
0.061 0.058 | 0.063 |
| 3 spectra, TSEAAK | 0.000 | 0.000 | 0.000 | 0.000 | 0.000 | 0.000 | 0.911 | 0.089 | ||
| 2 spectra, SFPVNSDVGVLK | 0.000 | 0.000 | 0.000 | 0.000 | 0.000 | 0.000 | 0.914 | 0.086 | ||
| 4 spectra, NTLEWCLPVIDAK | 0.000 | 0.000 | 0.000 | 0.027 | 0.000 | 0.000 | 0.893 | 0.080 | ||
| 2 spectra, VLLAAAVCTK | 0.000 | 0.000 | 0.000 | 0.020 | 0.000 | 0.000 | 0.853 | 0.127 | ||
| 3 spectra, NYCNIQVTK | 0.000 | 0.000 | 0.000 | 0.155 | 0.000 | 0.000 | 0.784 | 0.061 | ||
| 2 spectra, LMNTGK | 0.000 | 0.000 | 0.000 | 0.000 | 0.010 | 0.000 | 0.970 | 0.020 | ||
| 4 spectra, SEGETIMSSNMGK | 0.000 | 0.000 | 0.000 | 0.049 | 0.149 | 0.000 | 0.802 | 0.000 | ||
| 4 spectra, VIPEYCR | 0.000 | 0.000 | 0.000 | 0.000 | 0.000 | 0.000 | 0.877 | 0.123 | ||
| 3 spectra, QFVEMTR | 0.000 | 0.000 | 0.000 | 0.000 | 0.049 | 0.000 | 0.951 | 0.000 | ||
| 4 spectra, GVQLQTHPNVDK | 0.000 | 0.000 | 0.000 | 0.000 | 0.045 | 0.000 | 0.904 | 0.050 | ||
| 3 spectra, LFTAESLIGLK | 0.000 | 0.000 | 0.000 | 0.000 | 0.000 | 0.000 | 0.970 | 0.030 | ||
| 4 spectra, EVDNFVDK | 0.000 | 0.000 | 0.000 | 0.000 | 0.000 | 0.000 | 0.928 | 0.072 | ||
| 5 spectra, DGGLQNMELHGMIMLR | 0.000 | 0.000 | 0.000 | 0.000 | 0.107 | 0.000 | 0.893 | 0.000 | ||
| 2 spectra, QHTFVETESVR | 0.000 | 0.000 | 0.000 | 0.050 | 0.000 | 0.089 | 0.862 | 0.000 | ||
| 6 spectra, TFTEMDSHEEK | 0.000 | 0.000 | 0.000 | 0.000 | 0.000 | 0.000 | 0.852 | 0.148 | ||
| 5 spectra, VTQVDGNSPVR | 0.000 | 0.000 | 0.000 | 0.000 | 0.042 | 0.000 | 0.958 | 0.000 | ||
| 7 spectra, VAPAPARPSGPSK | 0.000 | 0.000 | 0.000 | 0.000 | 0.000 | 0.000 | 0.925 | 0.075 | ||
| 2 spectra, ENVNLAQIR | 0.000 | 0.000 | 0.000 | 0.000 | 0.000 | 0.000 | 0.937 | 0.063 | ||
| 10 spectra, ITLTCGR | 0.000 | 0.000 | 0.000 | 0.000 | 0.000 | 0.000 | 0.806 | 0.194 | ||
| 3 spectra, LYMVLITTK | 0.000 | 0.000 | 0.000 | 0.000 | 0.051 | 0.000 | 0.949 | 0.000 | ||
| 7 spectra, NSNILEDLETLR | 0.000 | 0.000 | 0.000 | 0.000 | 0.019 | 0.000 | 0.959 | 0.023 |
| Plot | Mito | Lyso or Perox | ER | Golgi | PM | Cytosol | Nucleus | ||||||
| Expt B |
10 peptides |
22 spectra |
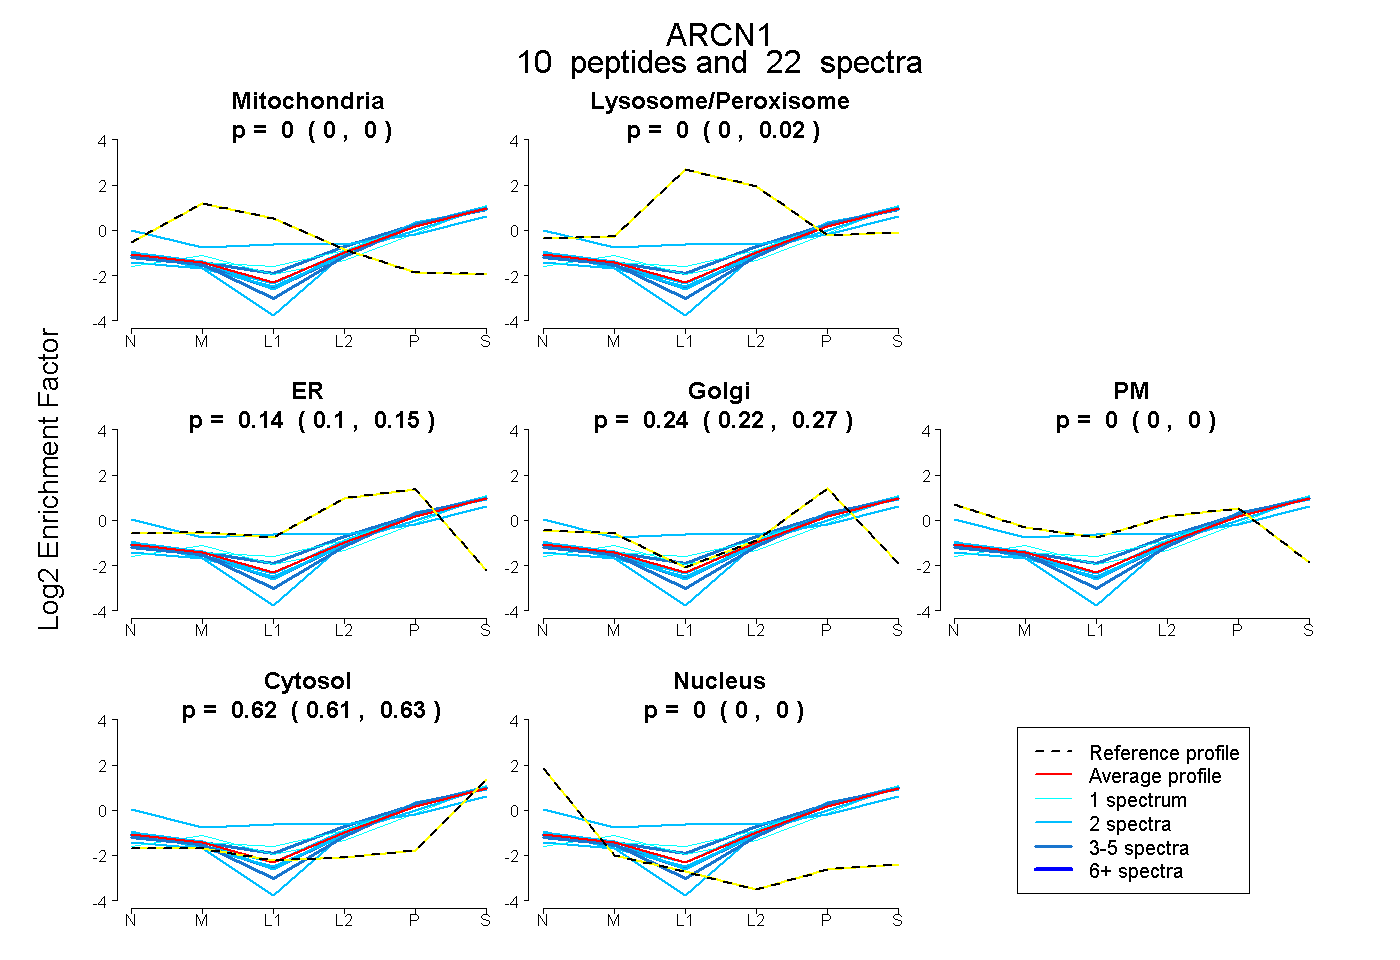 |
0.000 0.000 | 0.000 |
0.000 0.000 | 0.020 |
0.138 0.097 | 0.151 |
0.240 0.219 | 0.272 |
0.000 0.000 | 0.000 |
0.622 0.609 | 0.626 |
0.000 0.000 | 0.000 |
|||
| Plot | Lyso | Other | |||||||||||
| Expt C |
20 peptides |
78 spectra |
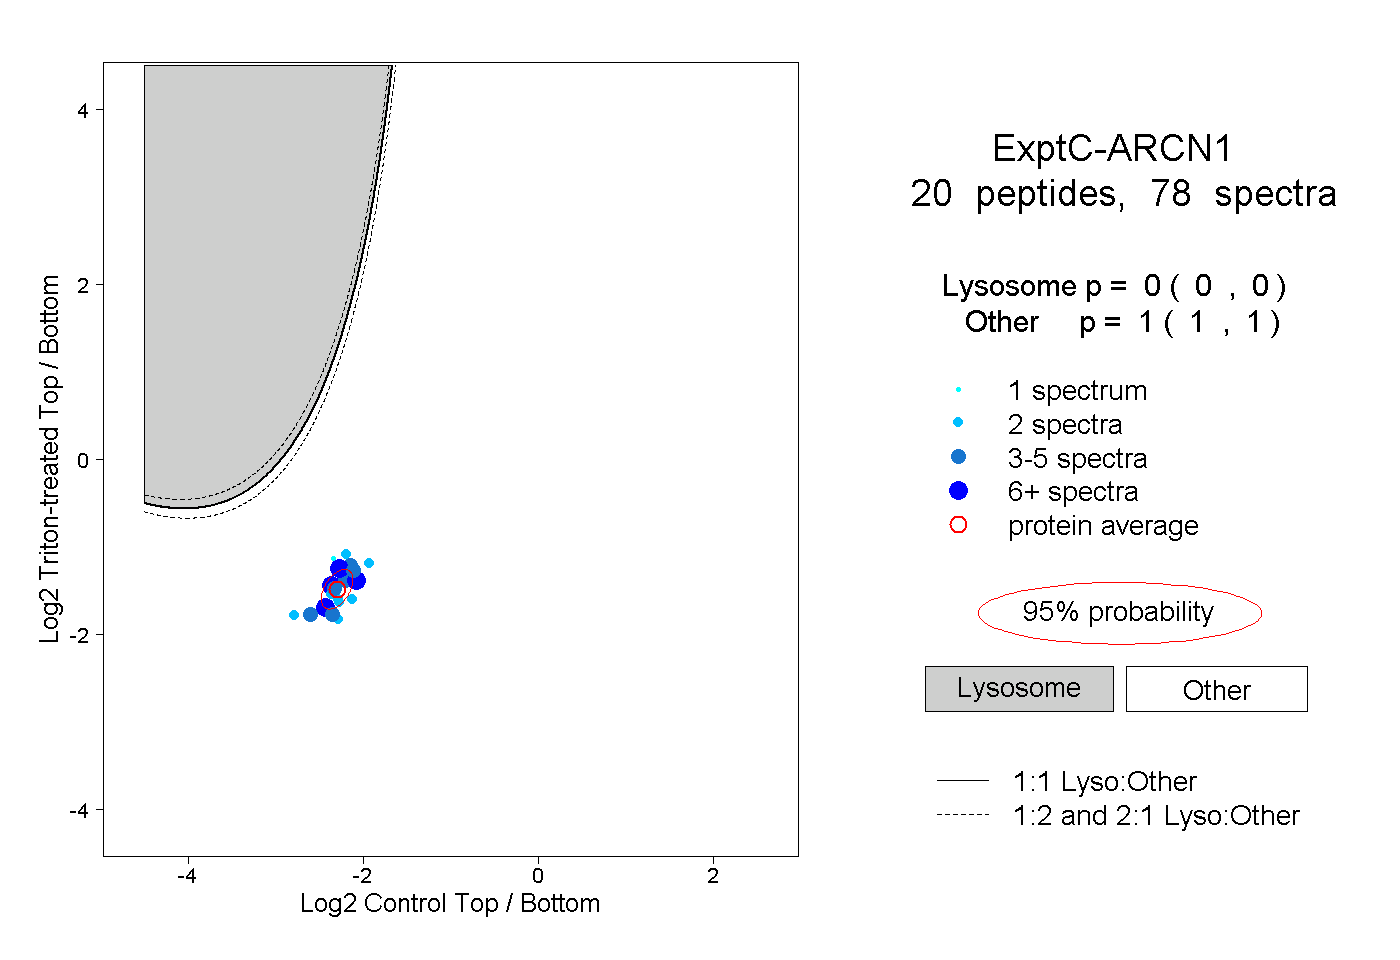 |
0.000 0.000 | 0.000 |
1.000 1.000 | 1.000 |
||||||||
| Plot | Lyso | Other | |||||||||||
| Expt D |
4 peptides |
7 spectra |
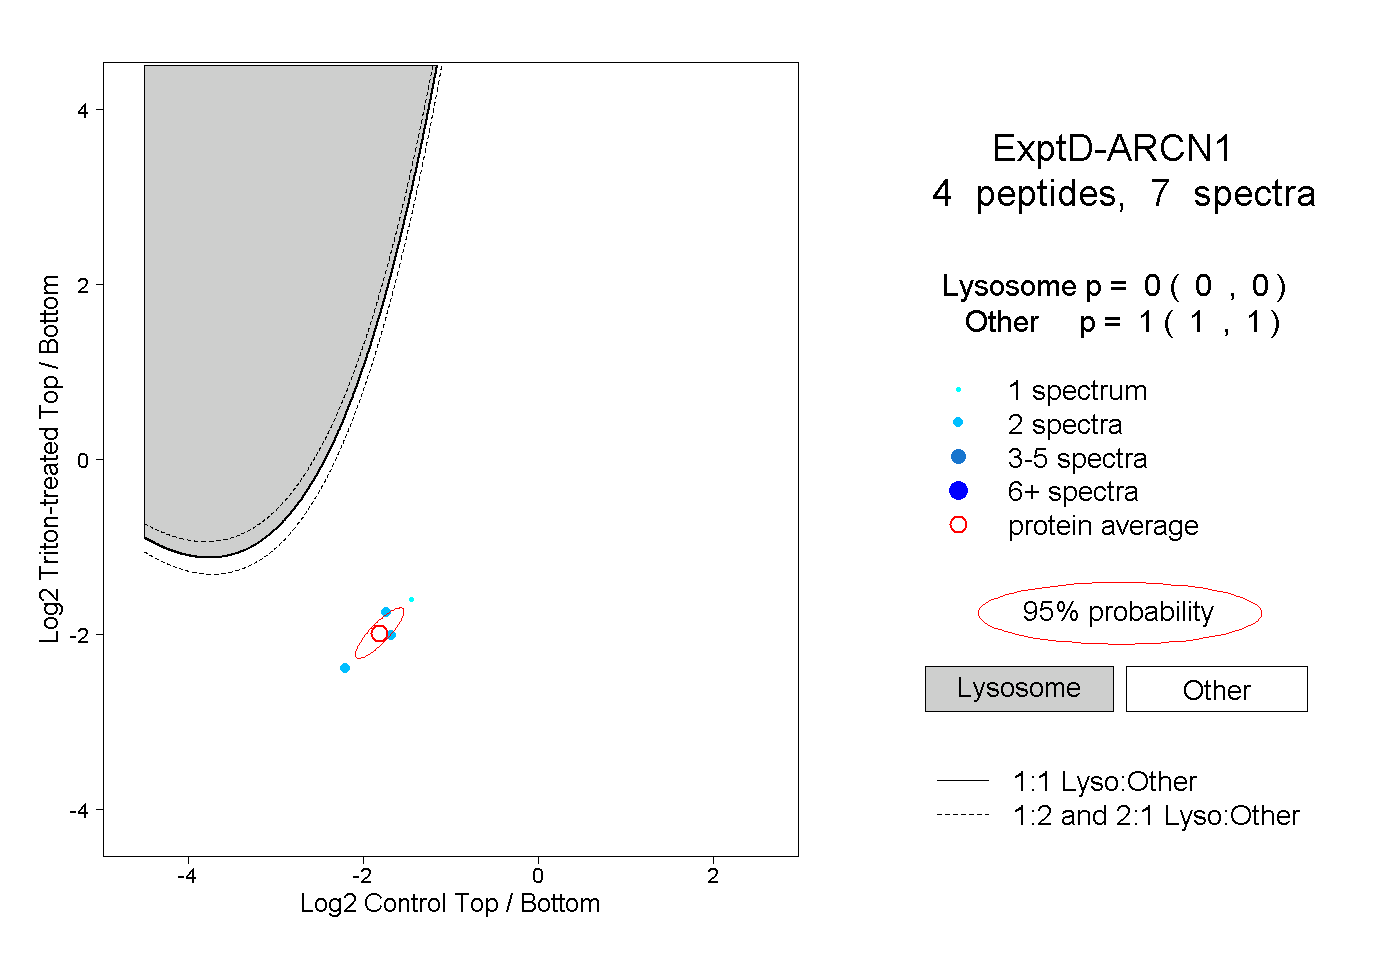 |
0.000 0.000 | 0.000 |
1.000 1.000 | 1.000 |