 21
21peptides
spectra
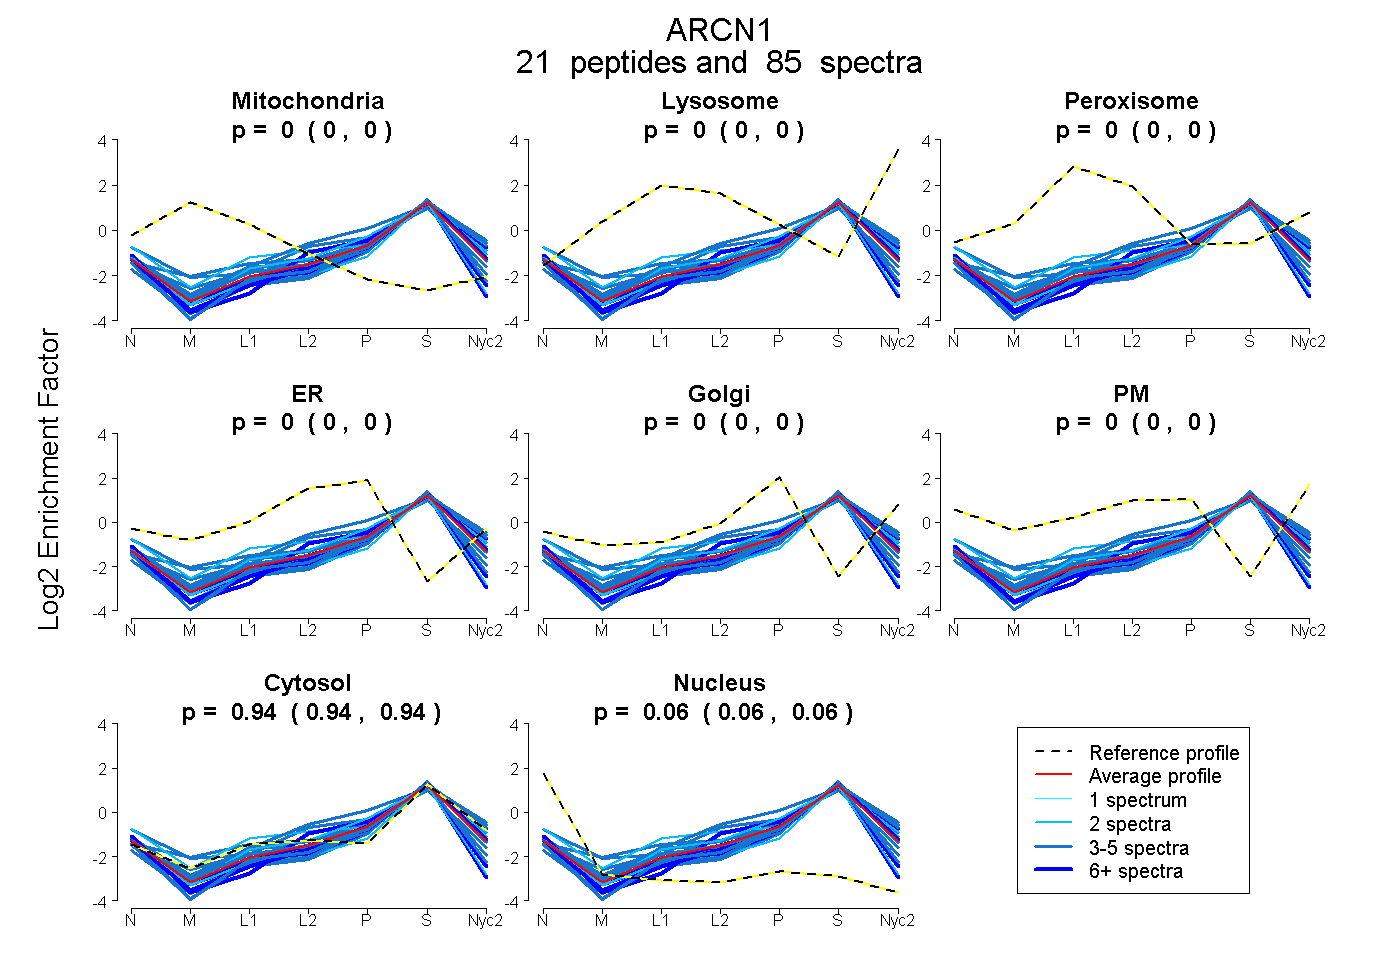
0.000 | 0.000
0.000 | 0.000
0.000 | 0.000
0.000 | 0.000
0.000 | 0.003
0.000 | 0.000
0.936 | 0.940
0.058 | 0.063
10peptides
spectra
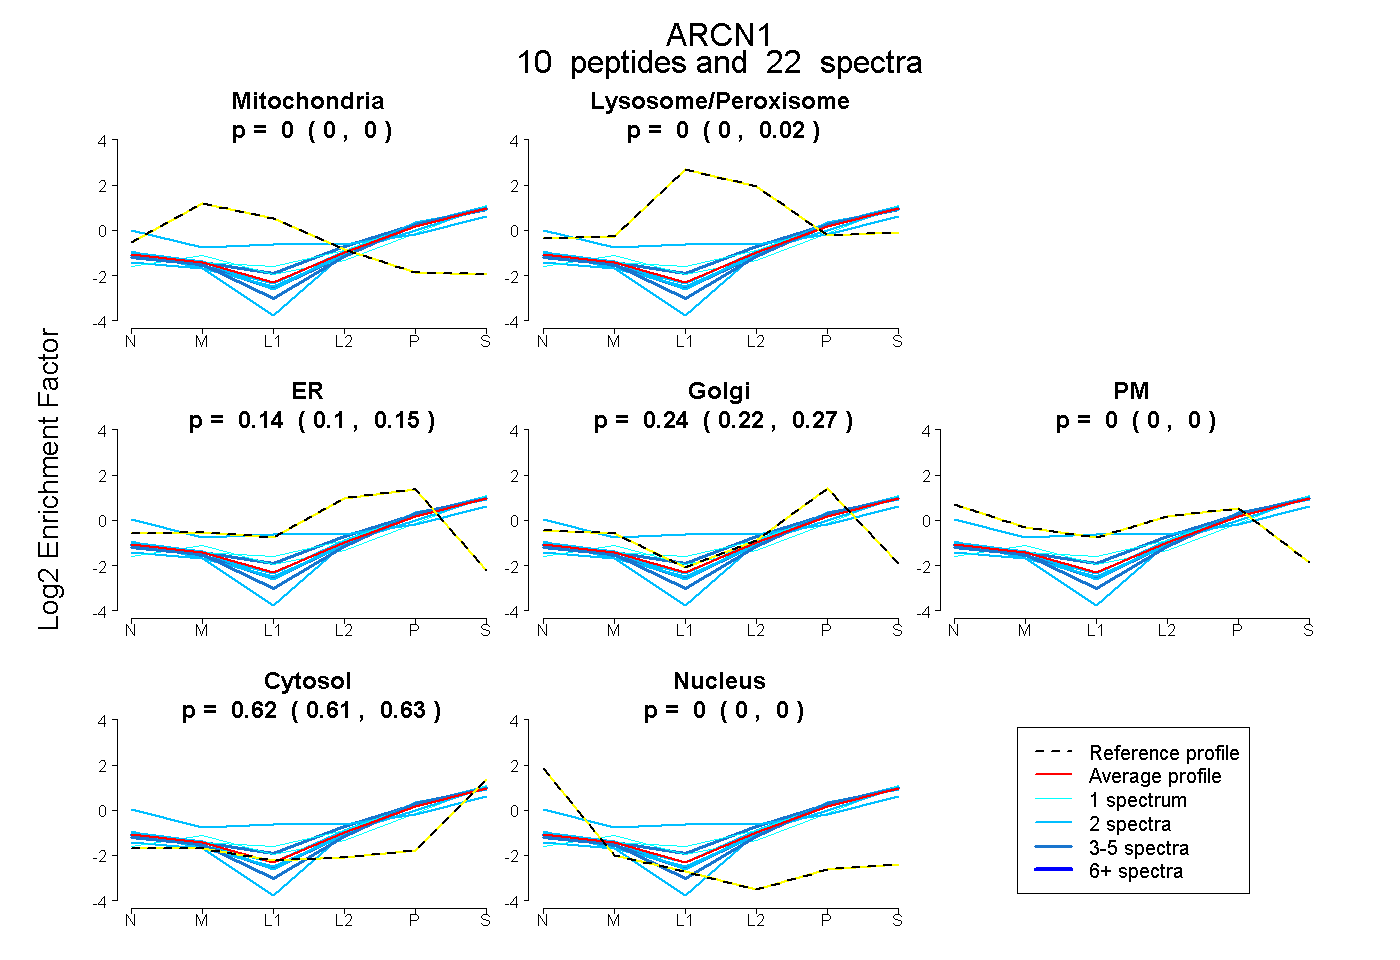
0.000 | 0.000
0.000 | 0.020
0.097 | 0.151
0.219 | 0.272
0.000 | 0.000
0.609 | 0.626
0.000 | 0.000
20peptides
spectra
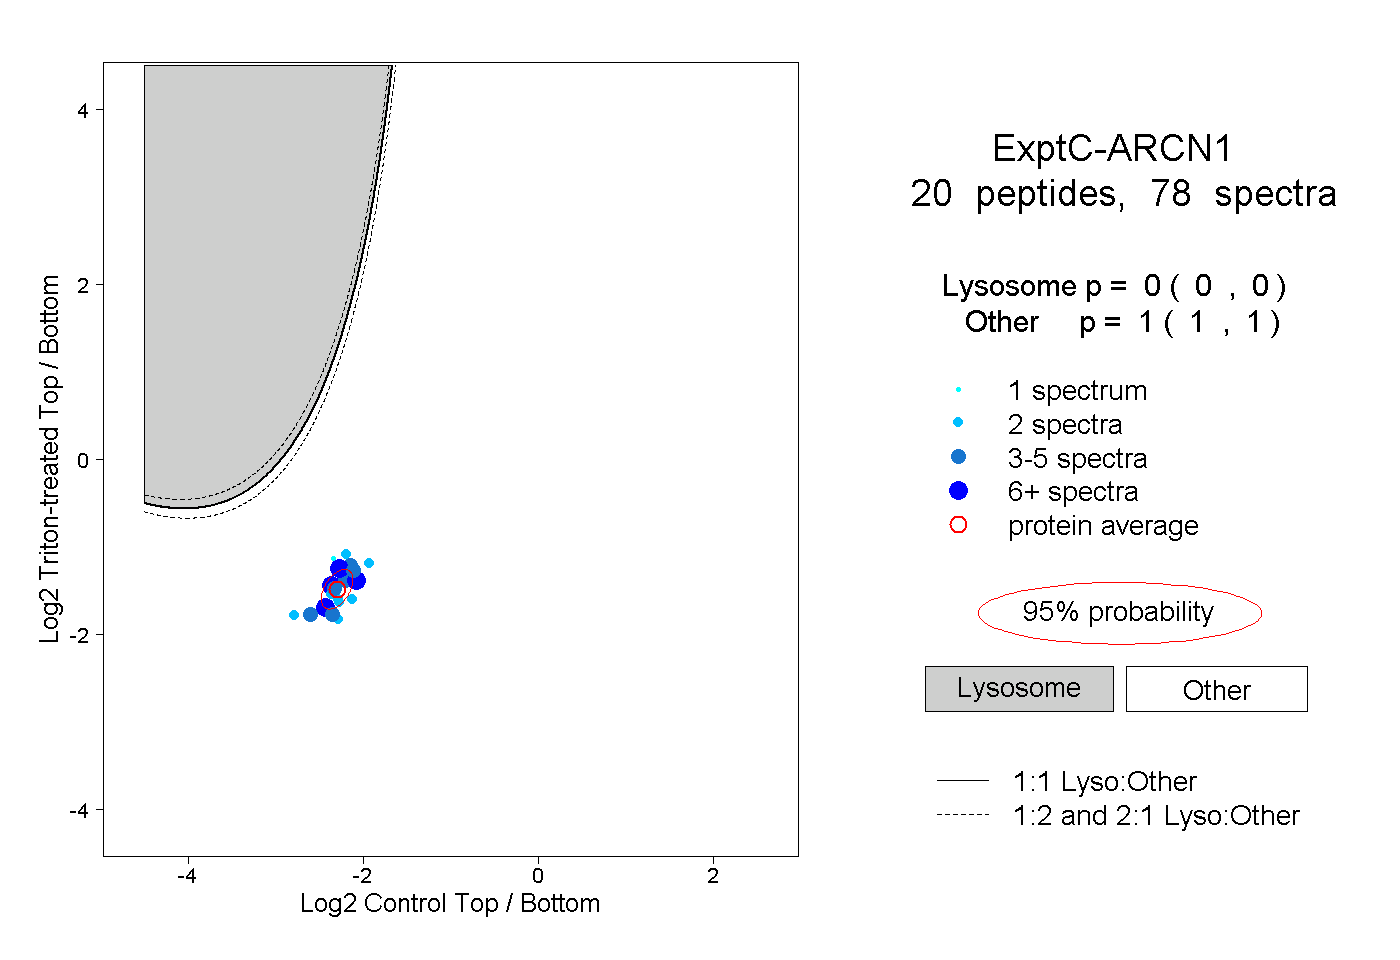
0.000 | 0.000
1.000 | 1.000
4peptides
spectra
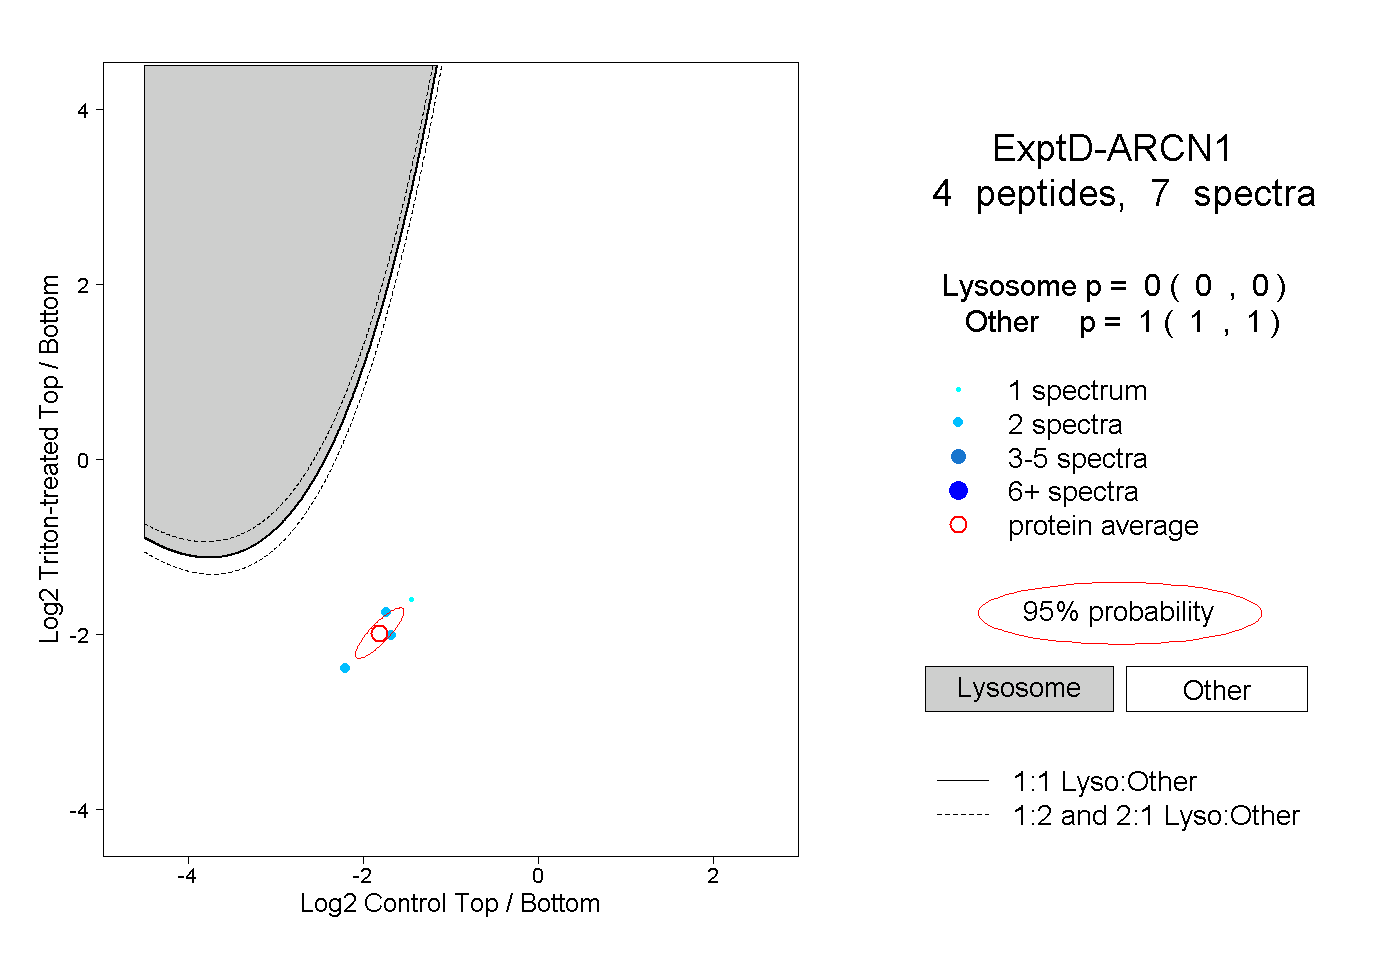
0.000 | 0.000
1.000 | 1.000