 1
1peptide
spectra
NA | NA
NA | NA
NA | NA
NA | NA
NA | NA
NA | NA
NA | NA
NA | NA
4peptides
spectra
0.000 | 0.176
0.822 | 1.000
| Plot | Mito | Lyso | Perox | ER | Golgi | PM | Cytosol | Nucleus | |||||
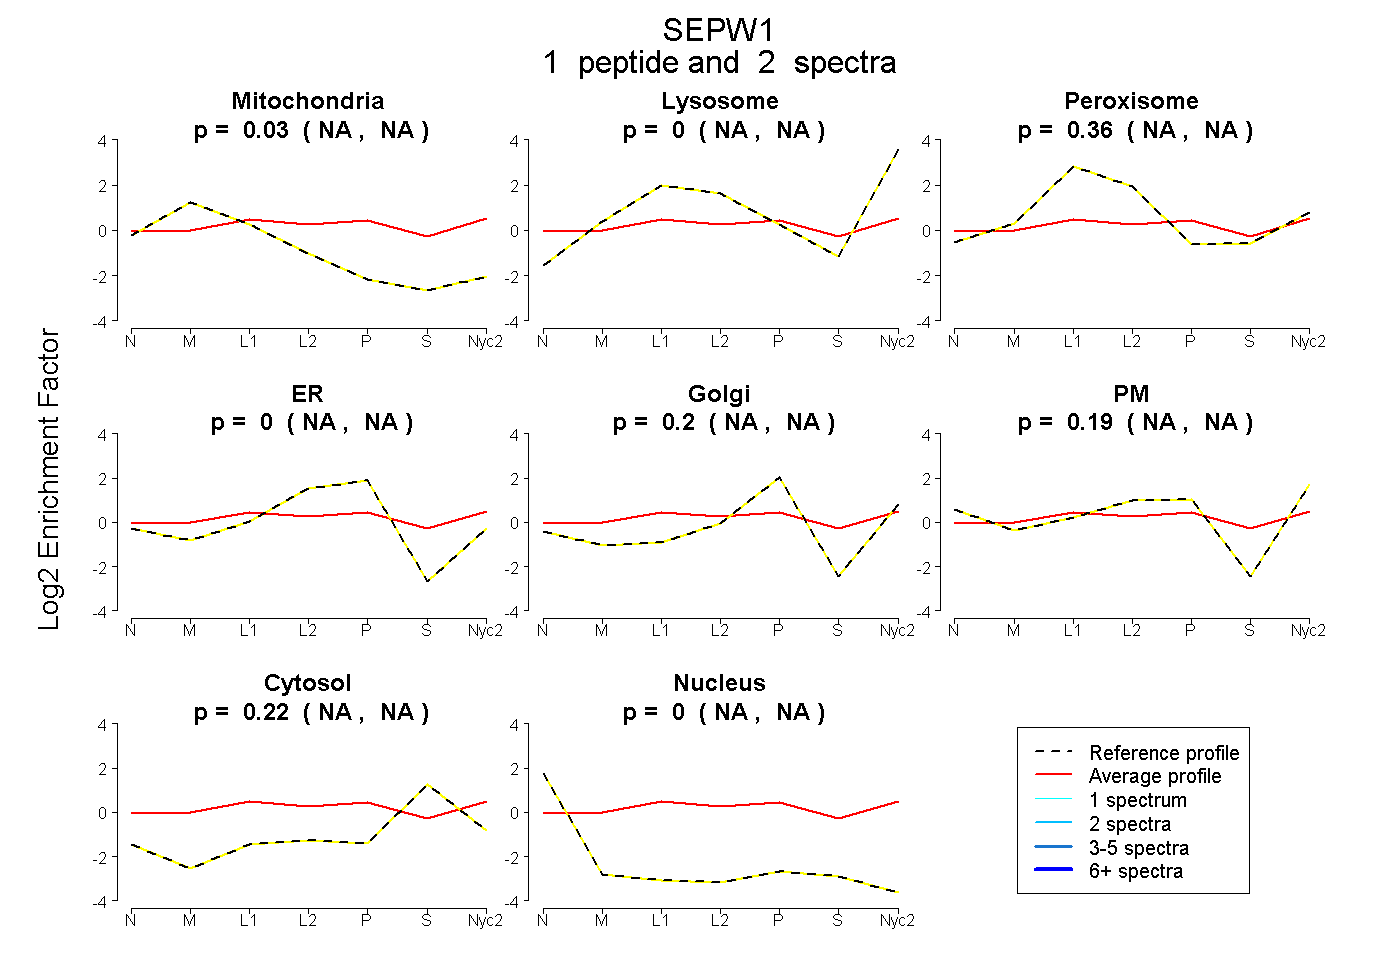
| Expt A |
1 peptide |
2 spectra |
|
0.026 NA | NA |
0.000 NA | NA |
0.363 NA | NA |
0.000 NA | NA |
0.196 NA | NA |
0.194 NA | NA |
0.222 NA | NA |
0.000 NA | NA |
||
| Plot | Lyso | Other | |||||||||||
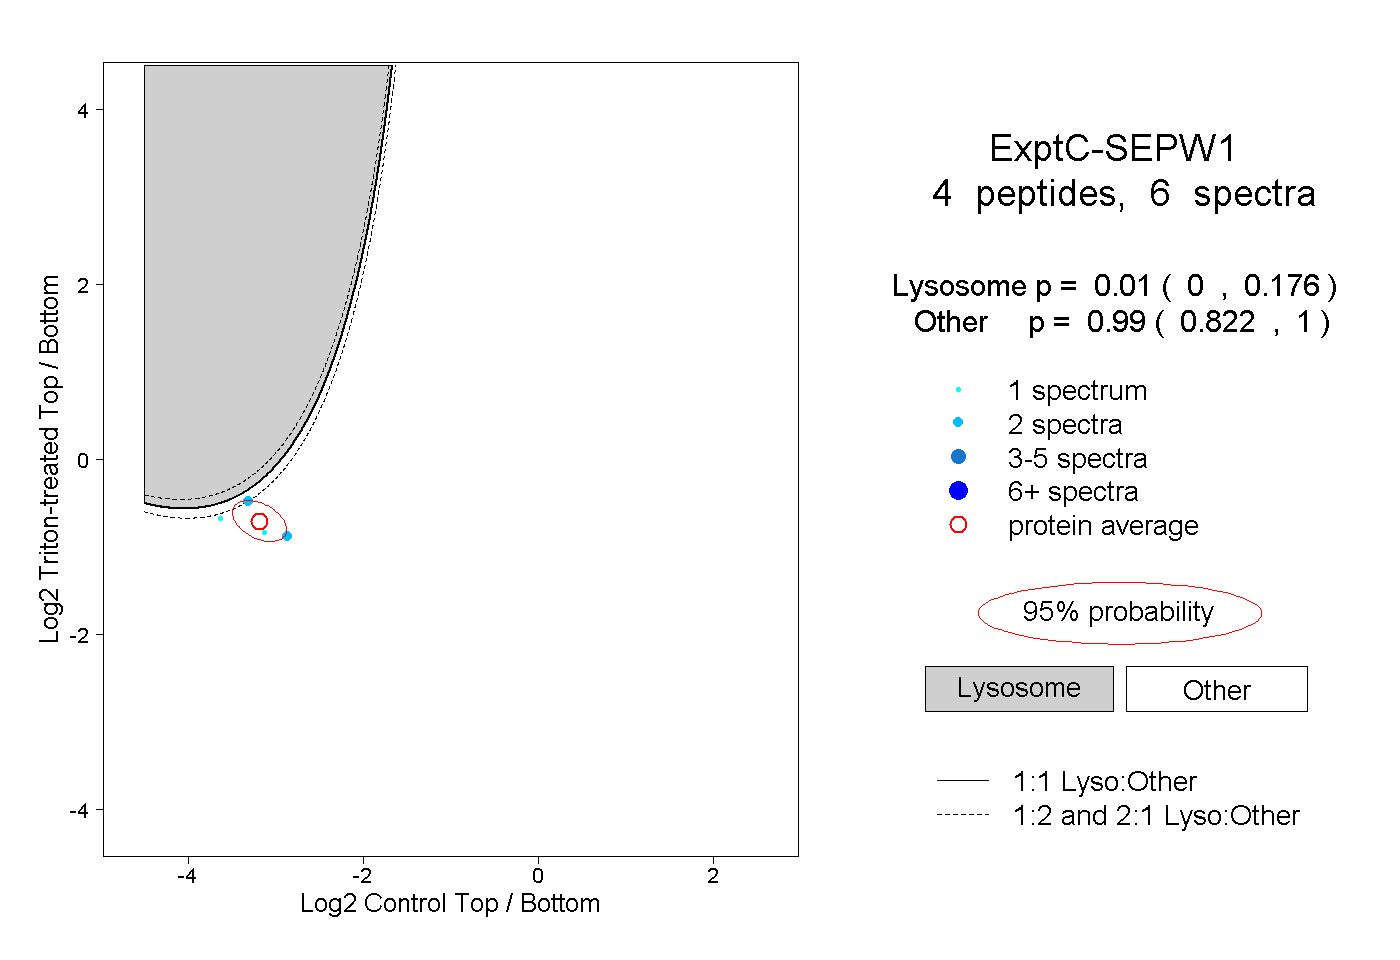
| Expt C |
4 peptides |
6 spectra |
|
0.010 0.000 | 0.176 |
0.990 0.822 | 1.000 |