 4
4peptides
spectra
0.000 | 0.121
0.000 | 0.000
0.000 | 0.071
0.103 | 0.322
0.000 | 0.175
0.000 | 0.166
0.368 | 0.558
0.069 | 0.218
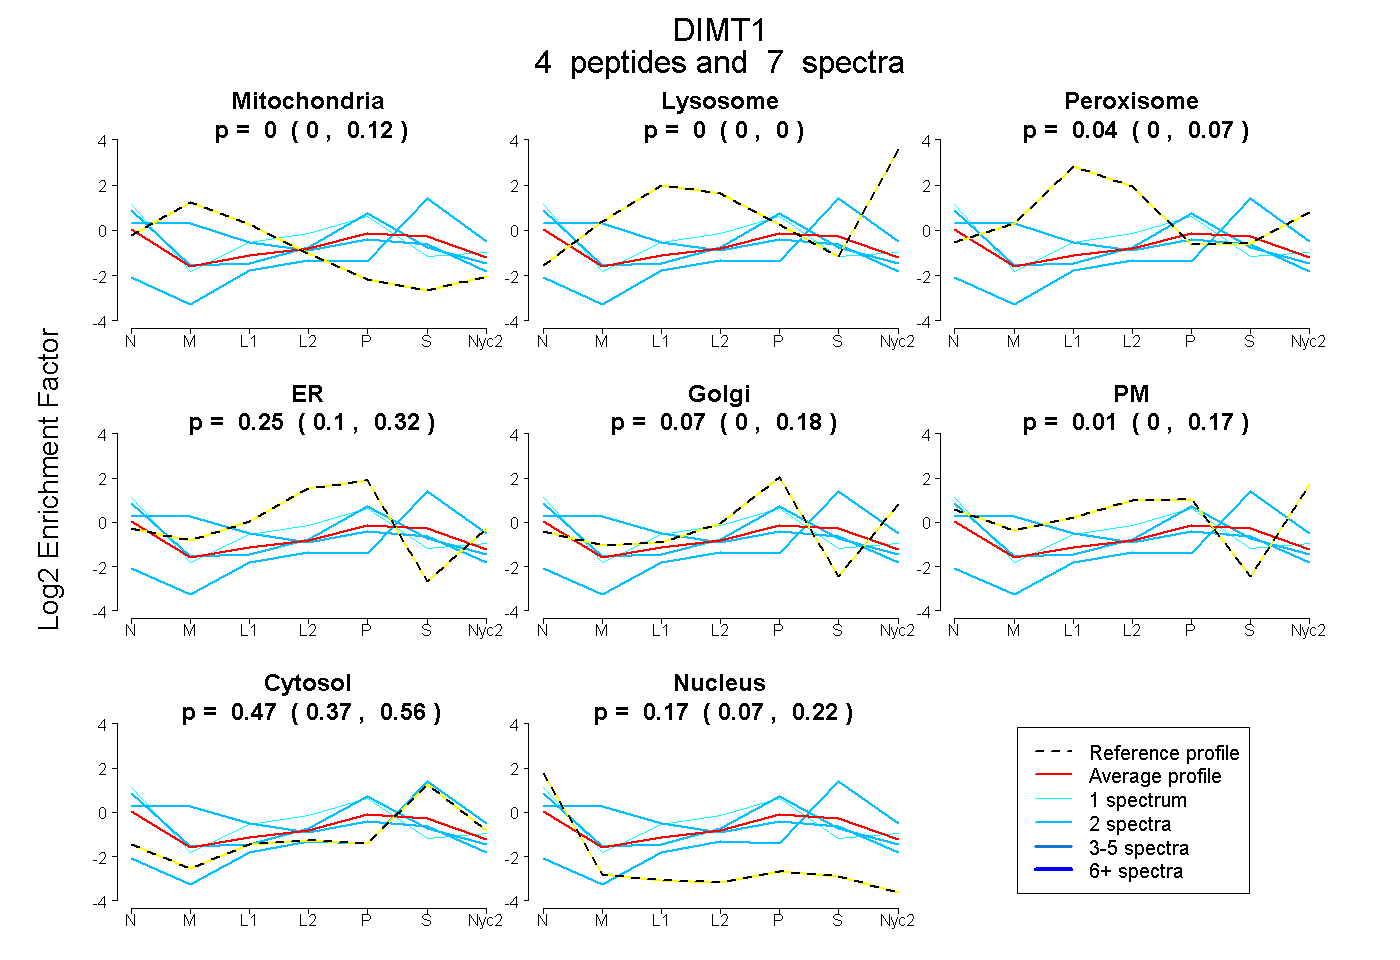
| Plot | Mito | Lyso | Perox | ER | Golgi | PM | Cytosol | Nucleus | |||||
| Expt A |
4 peptides |
7 spectra |
|
0.000 0.000 | 0.121 |
0.000 0.000 | 0.000 |
0.041 0.000 | 0.071 |
0.250 0.103 | 0.322 |
0.066 0.000 | 0.175 |
0.005 0.000 | 0.166 |
0.469 0.368 | 0.558 |
0.170 0.069 | 0.218 |
| 1 spectrum, LQVLVGDVLK | 0.000 | 0.000 | 0.013 | 0.384 | 0.000 | 0.189 | 0.200 | 0.215 | ||
| 2 spectra, LVAELHK | 0.000 | 0.000 | 0.000 | 0.000 | 0.000 | 0.000 | 1.000 | 0.000 | ||
| 2 spectra, SMDIDDFIR | 0.000 | 0.000 | 0.000 | 0.304 | 0.183 | 0.000 | 0.266 | 0.247 | ||
| 2 spectra, VQGTPLASK | 0.470 | 0.000 | 0.000 | 0.187 | 0.018 | 0.000 | 0.298 | 0.027 |