 2
2peptides
spectra
0.000 | 0.000
0.000 | 0.104
0.000 | 0.000
0.000 | 0.107
0.000 | 0.278
0.000 | 0.030
0.672 | 0.856
0.000 | 0.055
1peptide
spectrum
NA | NA
NA | NA
NA | NA
NA | NA
NA | NA
NA | NA
NA | NA
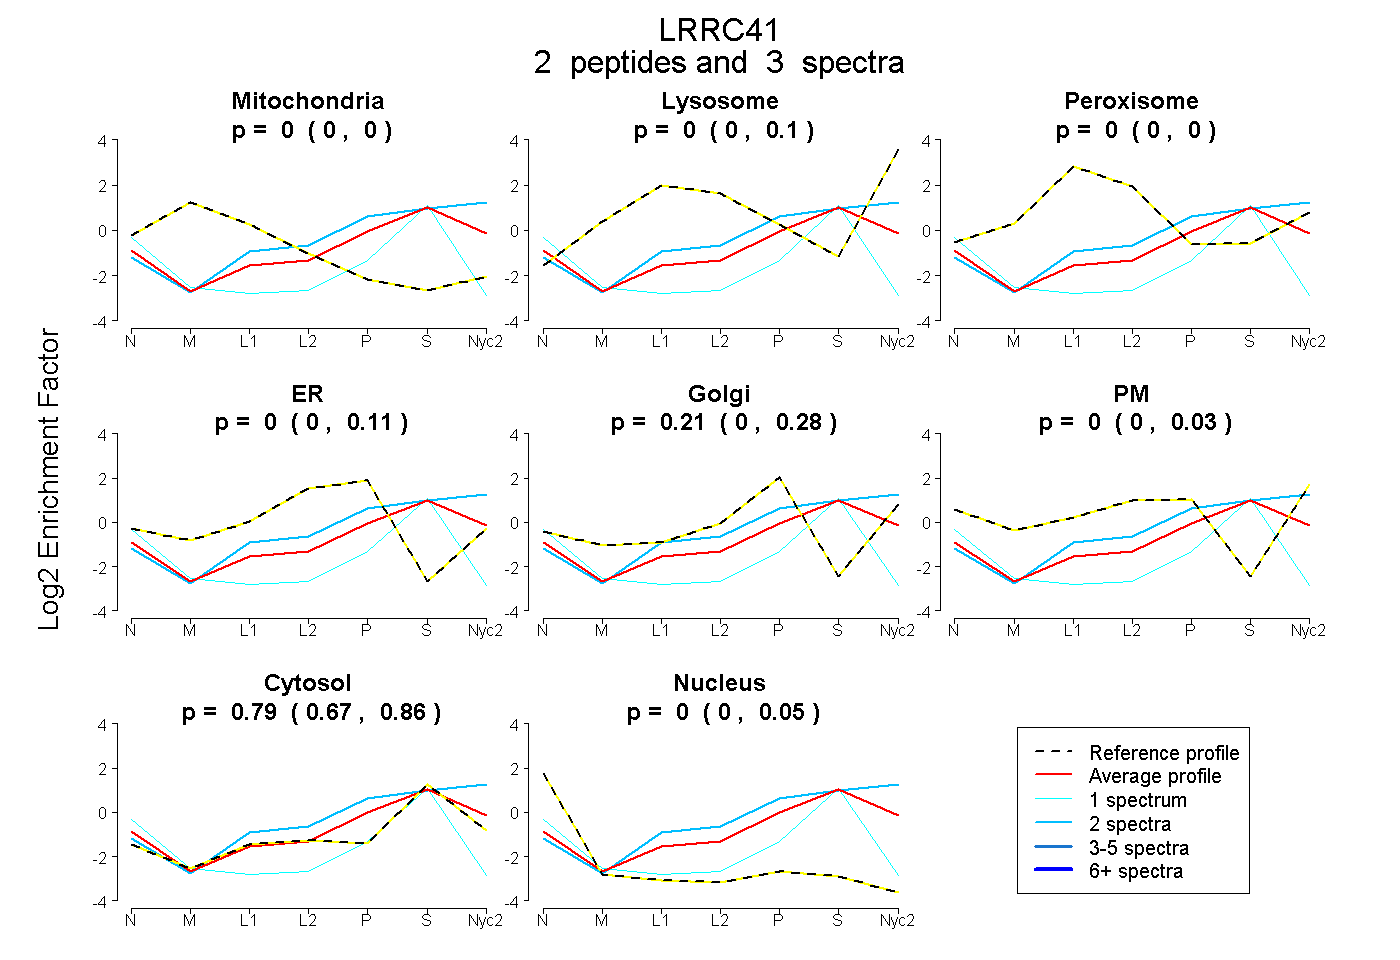
| Plot | Mito | Lyso | Perox | ER | Golgi | PM | Cytosol | Nucleus | |||||
| Expt A |
2 peptides |
3 spectra |
|
0.000 0.000 | 0.000 |
0.000 0.000 | 0.104 |
0.000 0.000 | 0.000 |
0.000 0.000 | 0.107 |
0.210 0.000 | 0.278 |
0.000 0.000 | 0.030 |
0.790 0.672 | 0.856 |
0.000 0.000 | 0.055 |
||
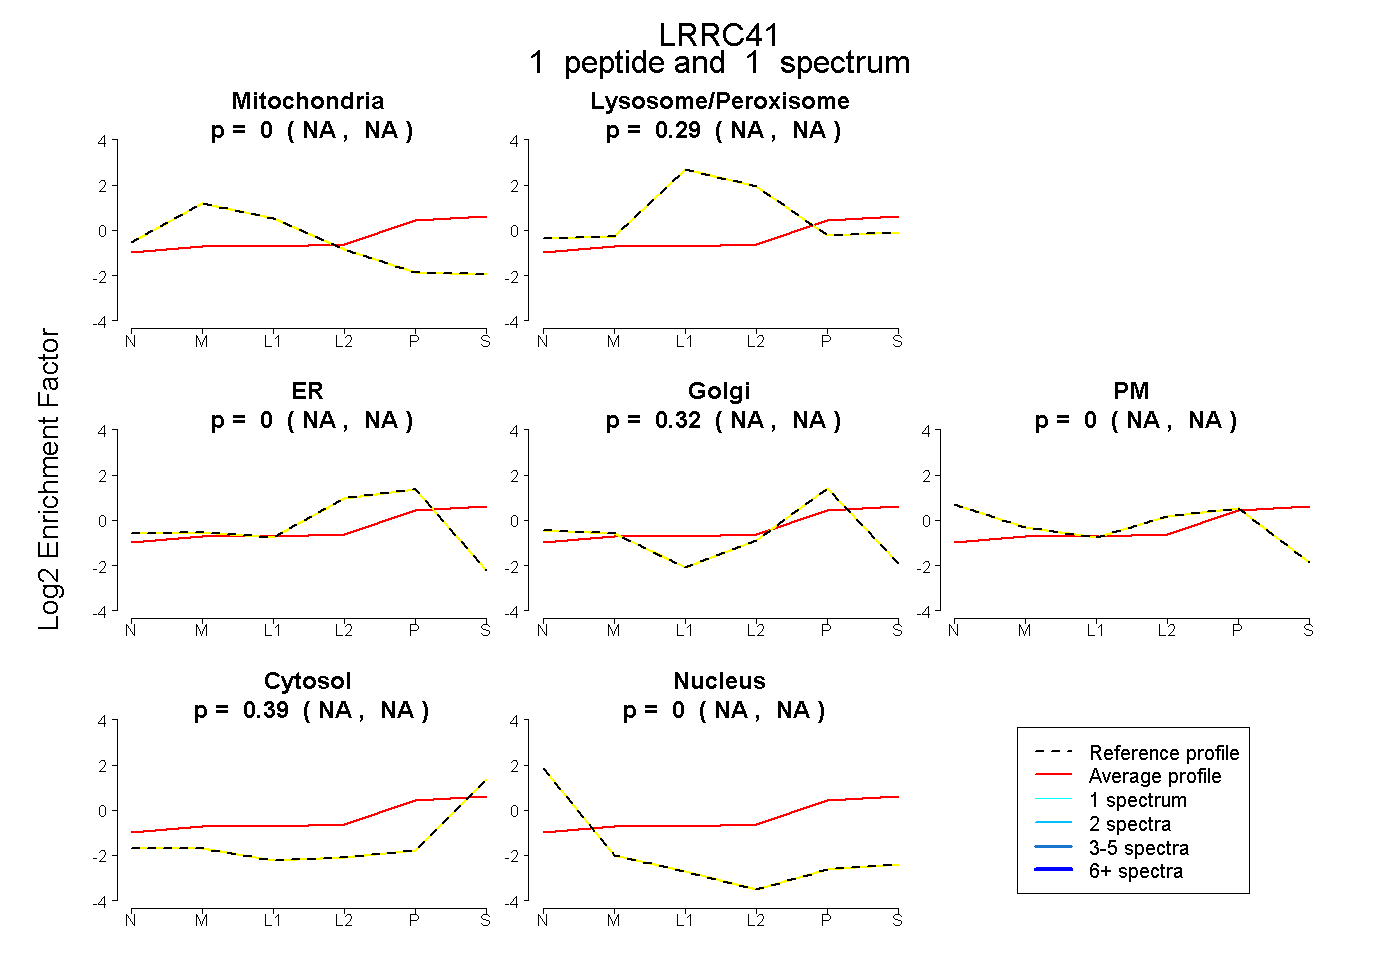
| Plot | Mito | Lyso or Perox | ER | Golgi | PM | Cytosol | Nucleus | ||||||
| Expt B |
1 peptide |
1 spectrum |
|
0.000 NA | NA |
0.290 NA | NA |
0.000 NA | NA |
0.321 NA | NA |
0.000 NA | NA |
0.390 NA | NA |
0.000 NA | NA |