 1
1peptide
spectra
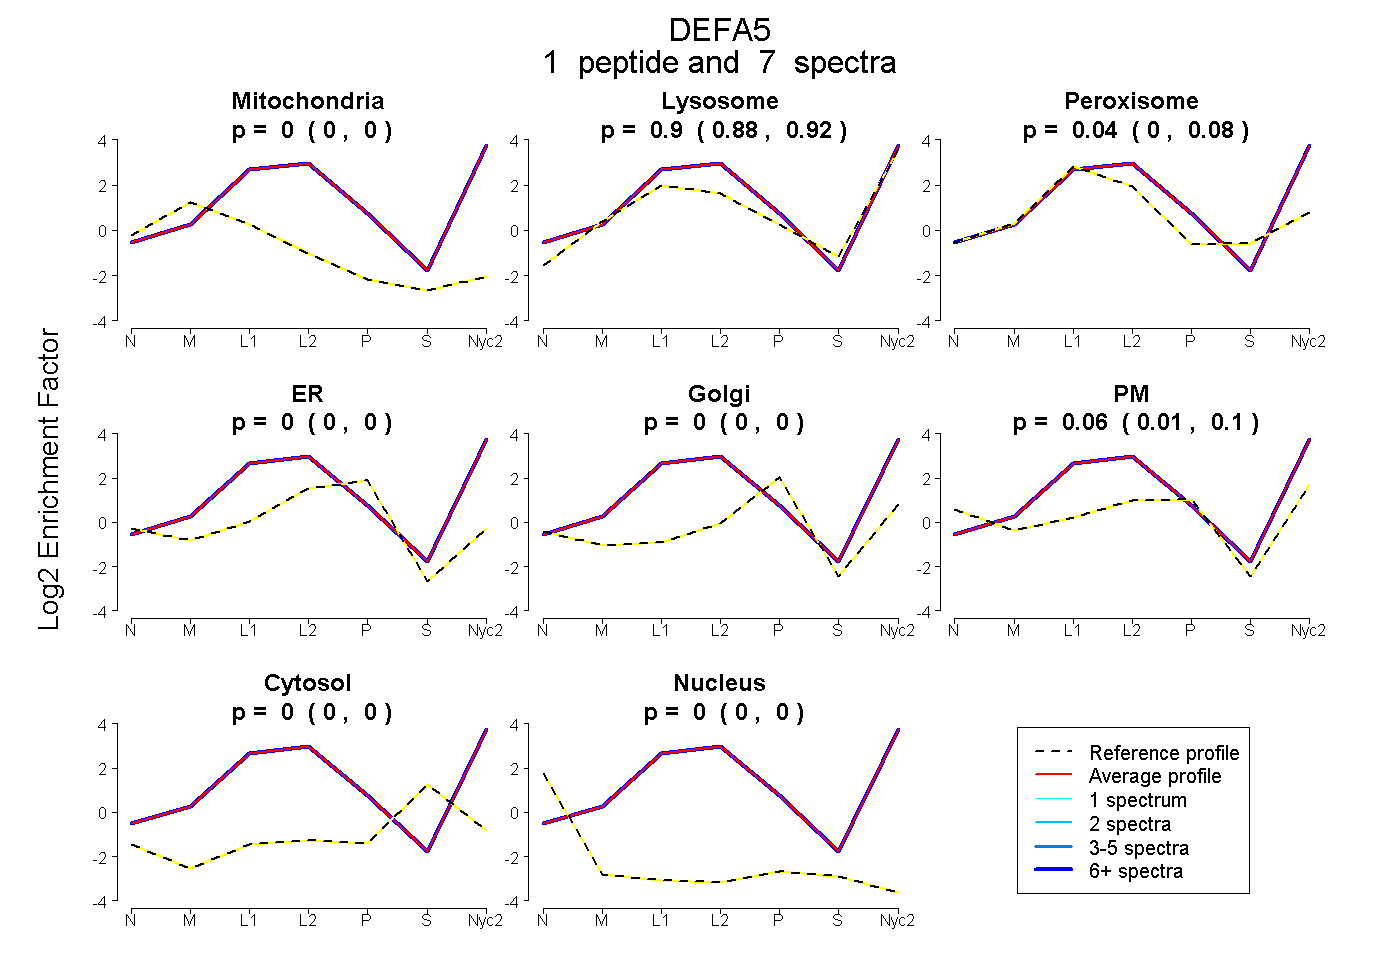
0.000 | 0.000
0.882 | 0.923
0.000 | 0.077
0.000 | 0.000
0.000 | 0.000
0.011 | 0.095
0.000 | 0.000
0.000 | 0.000
1peptide
spectra
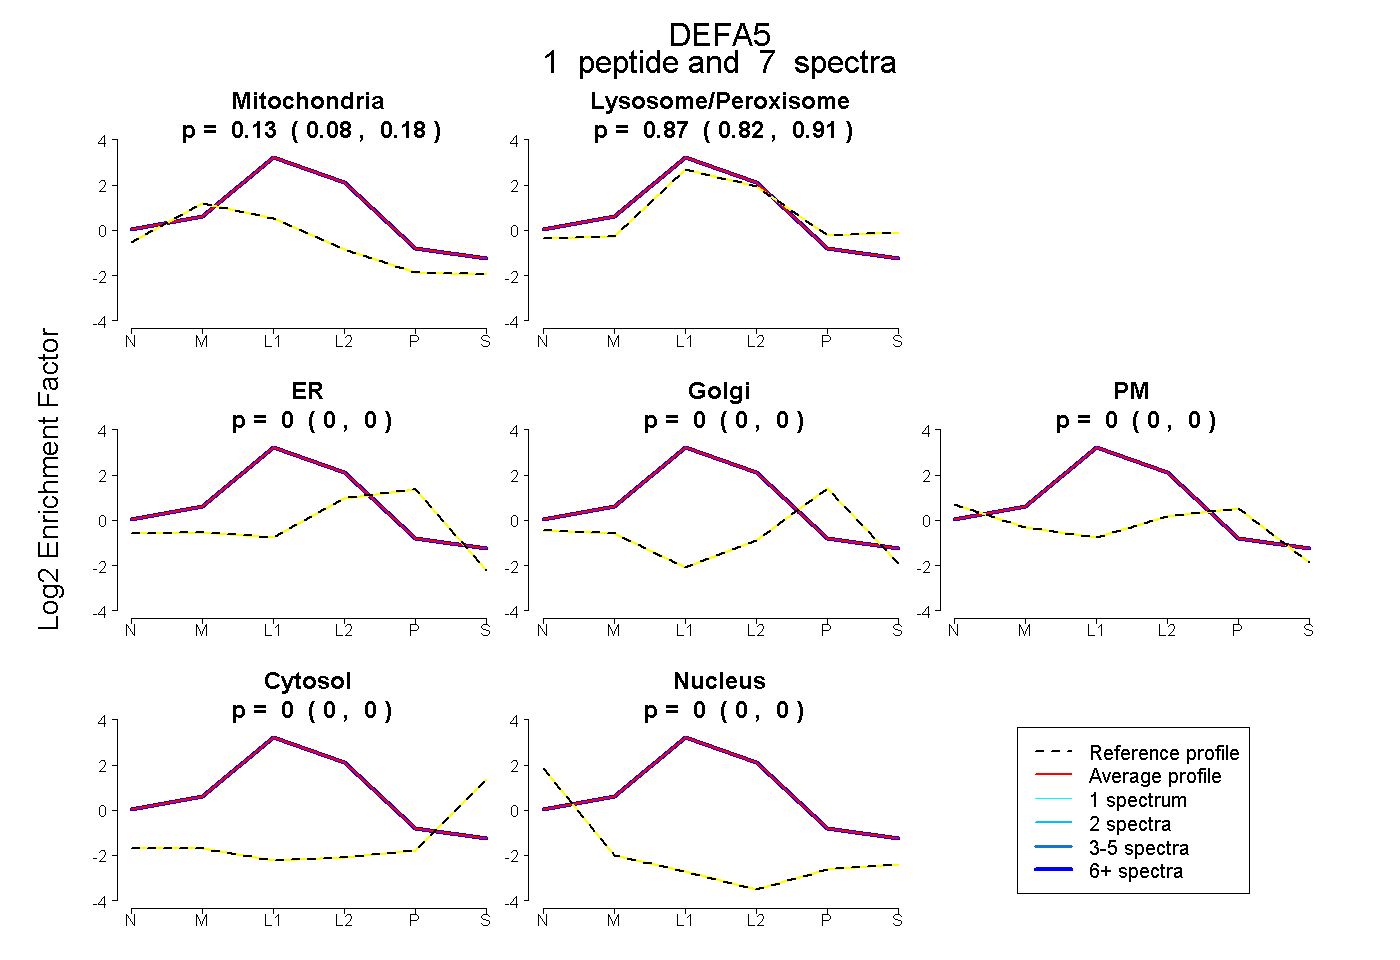
0.083 | 0.175
0.820 | 0.910
0.000 | 0.000
0.000 | 0.000
0.000 | 0.000
0.000 | 0.000
0.000 | 0.000
1peptide
spectra
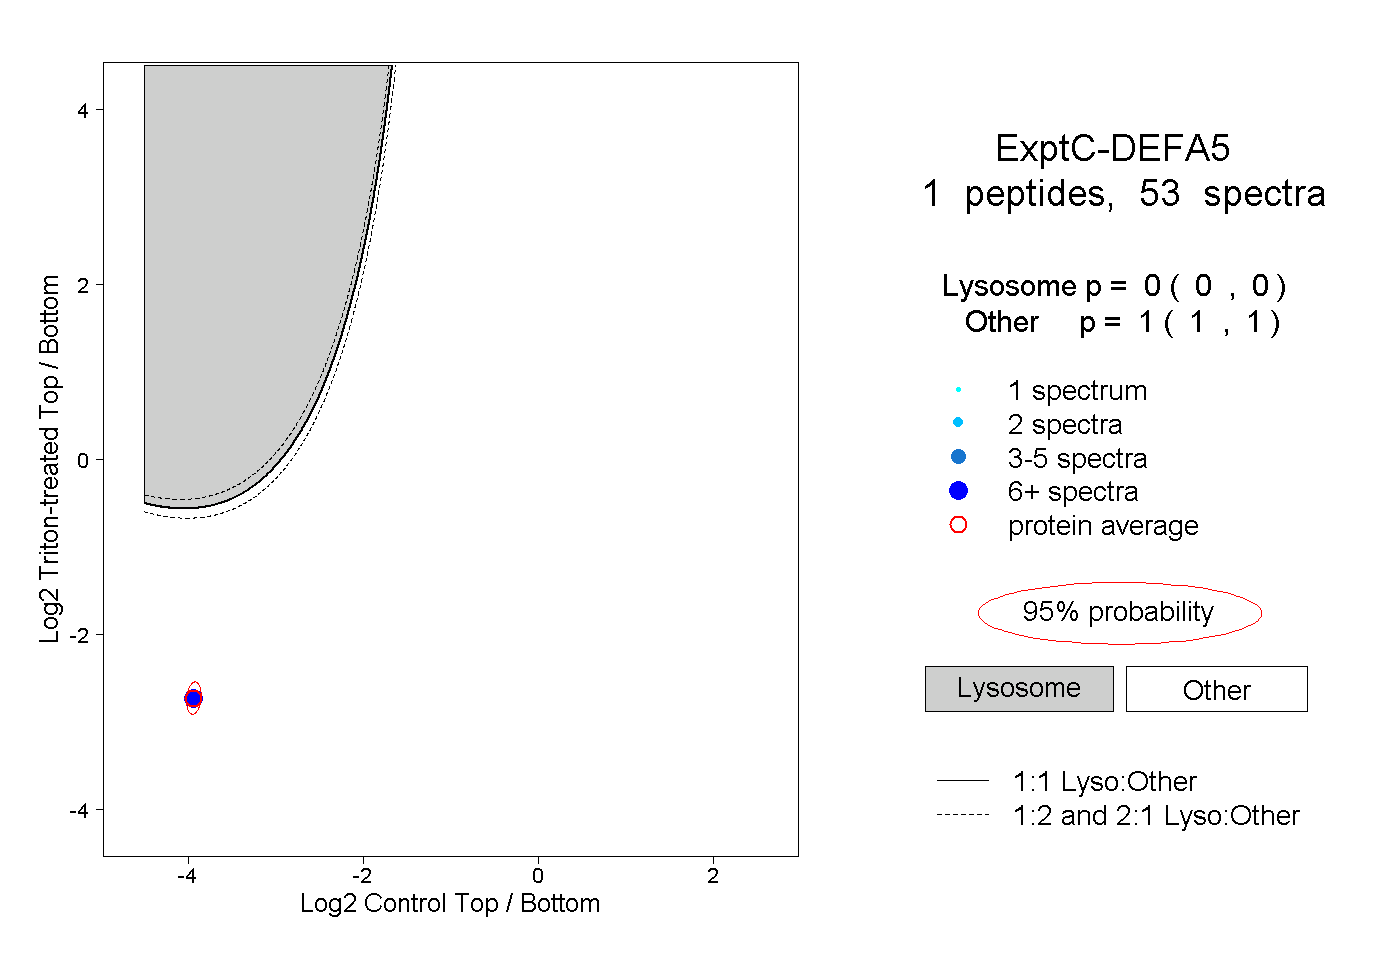
0.000 | 0.000
1.000 | 1.000
1peptide
spectra
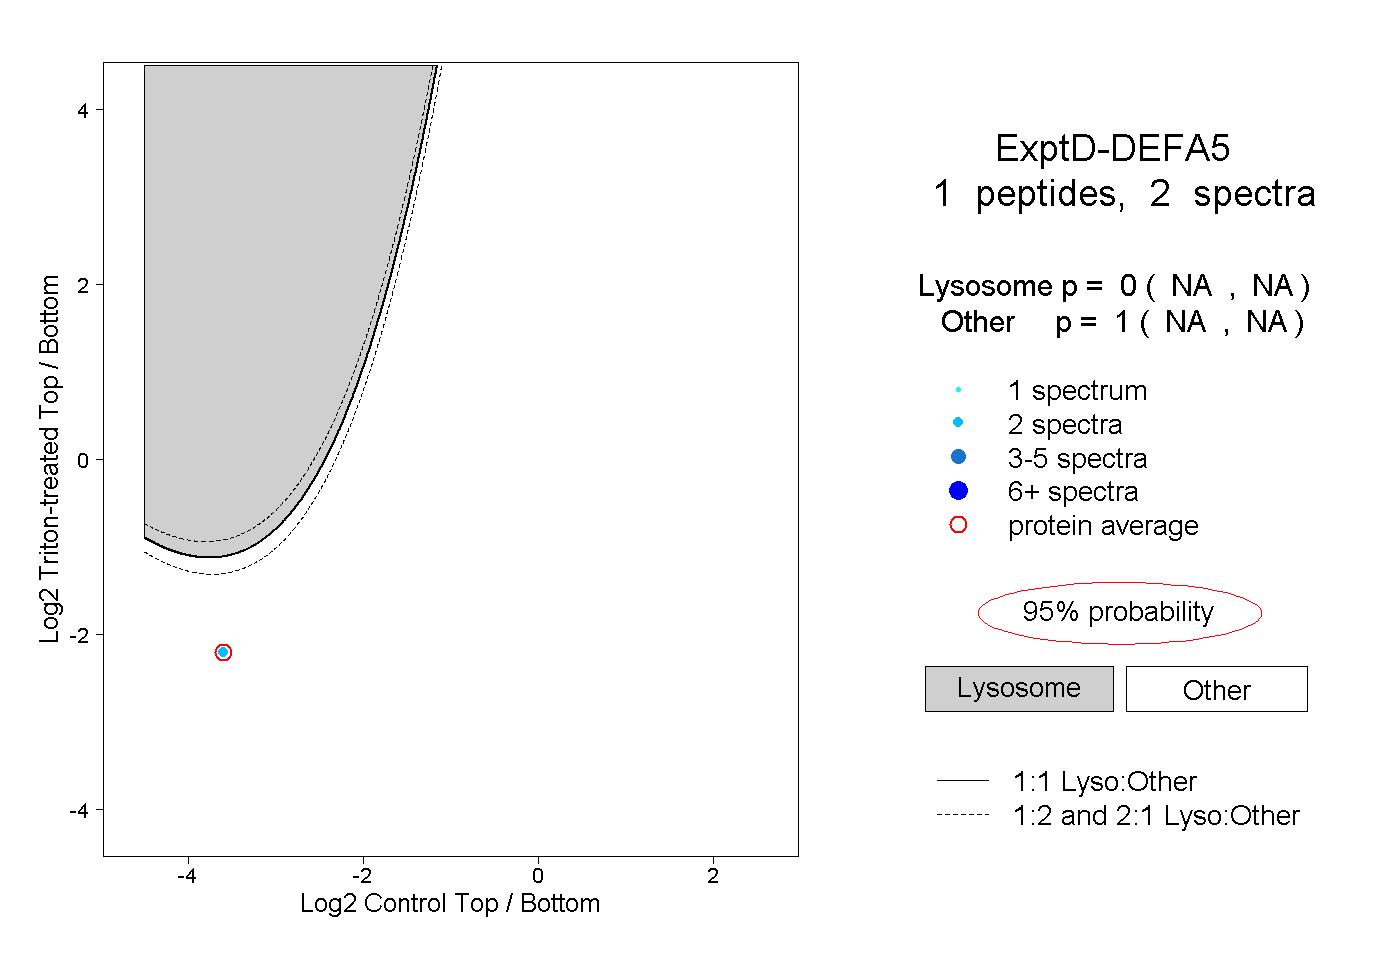
NA | NA
NA | NA