 2
2peptides
spectra
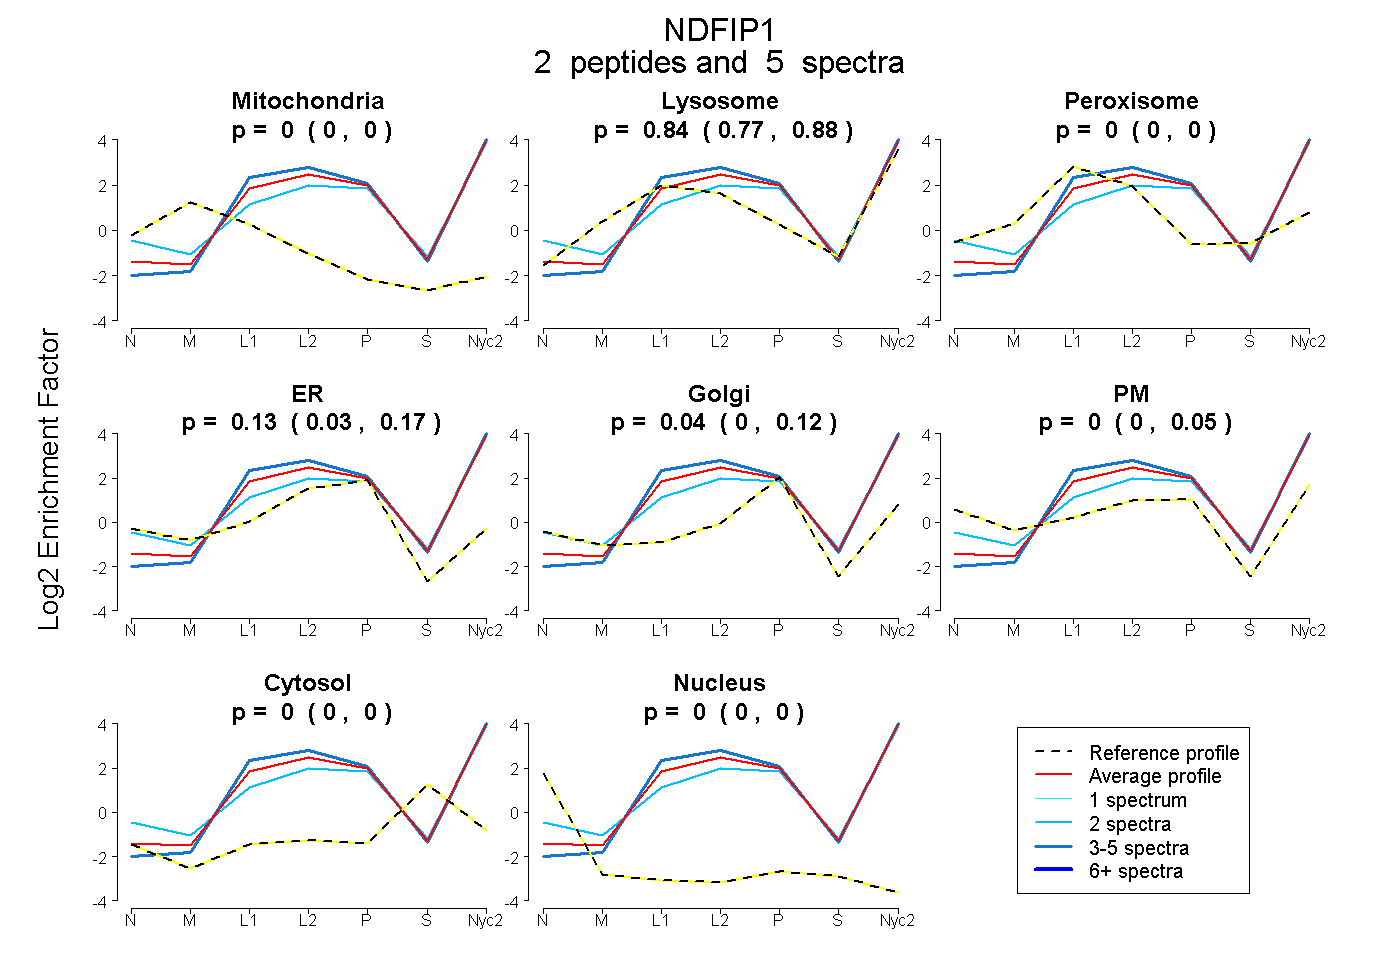
0.000 | 0.000
0.769 | 0.875
0.000 | 0.000
0.027 | 0.168
0.000 | 0.123
0.000 | 0.046
0.000 | 0.000
0.000 | 0.000
1peptide
spectra
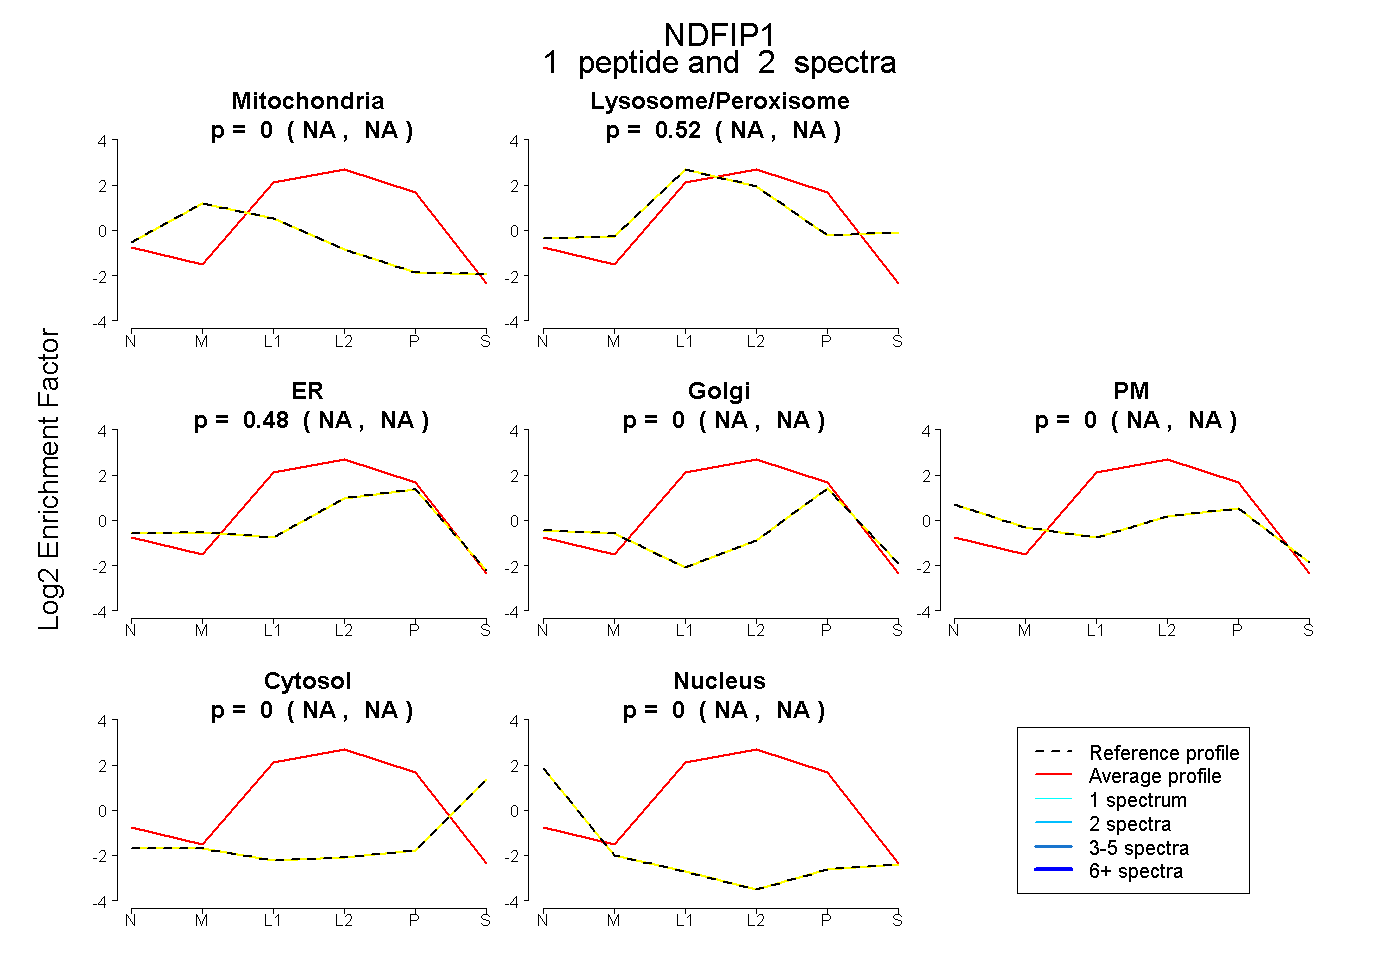
NA | NA
NA | NA
NA | NA
NA | NA
NA | NA
NA | NA
NA | NA
2peptides
spectra
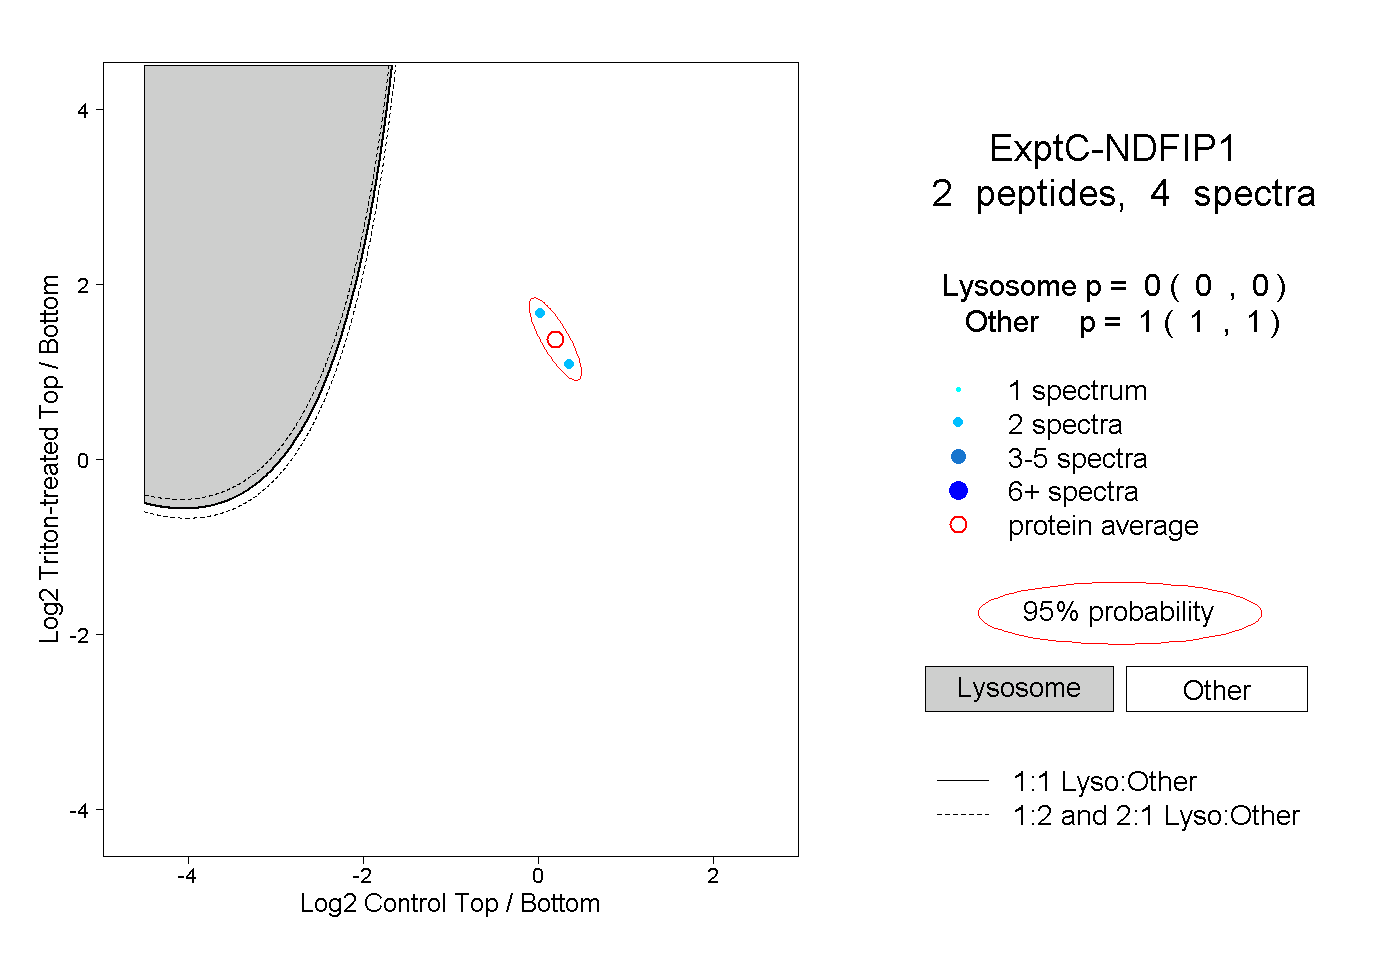
0.000 | 0.000
1.000 | 1.000