 4
4peptides
spectra
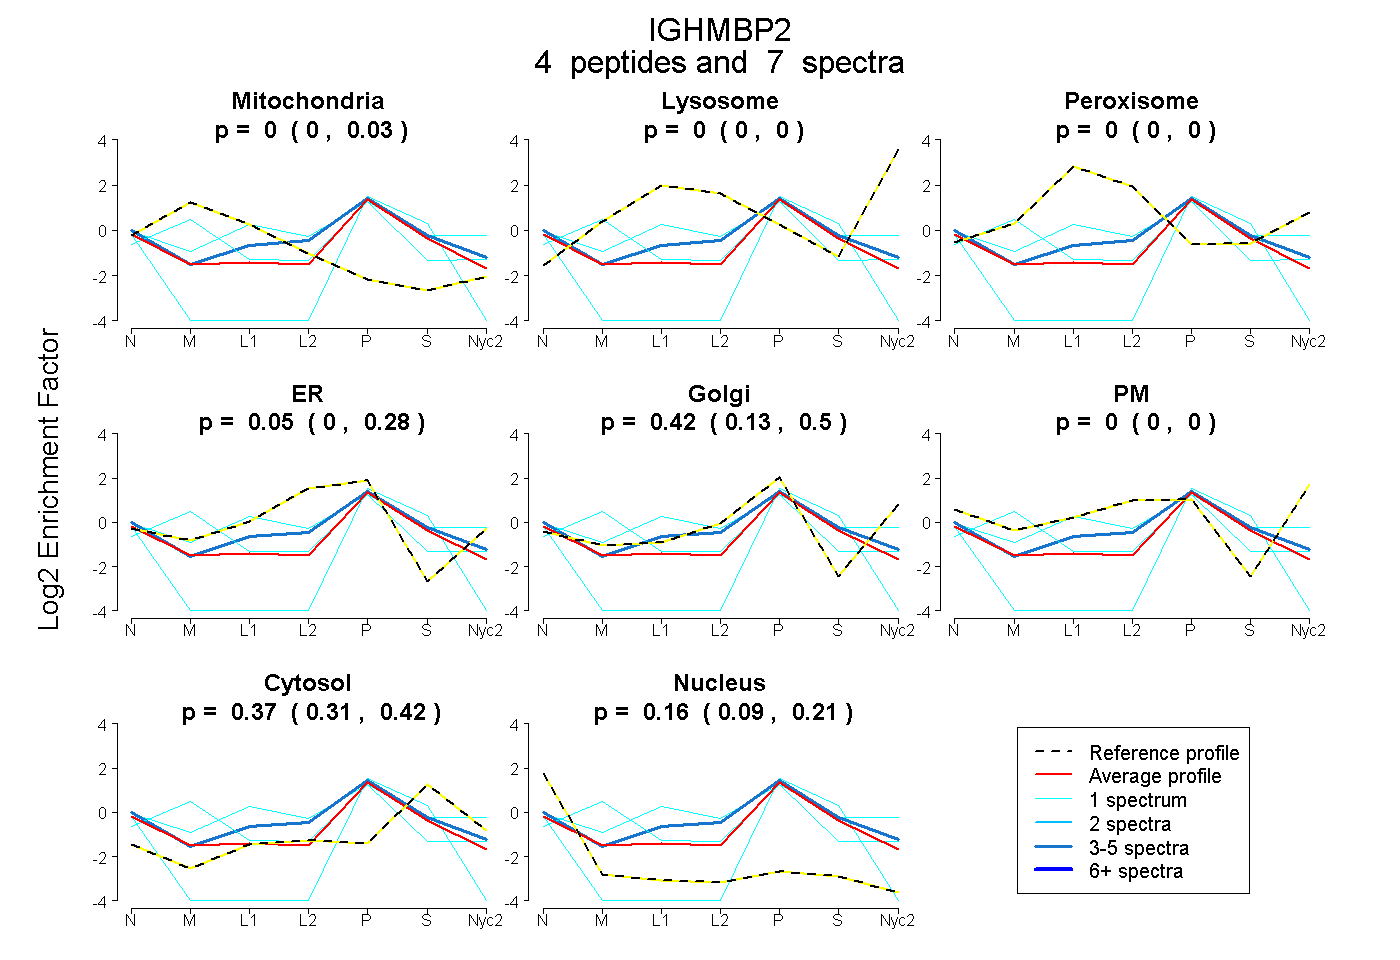
0.000 | 0.032
0.000 | 0.000
0.000 | 0.000
0.000 | 0.279
0.130 | 0.503
0.000 | 0.000
0.310 | 0.417
0.091 | 0.213
2peptides
spectra
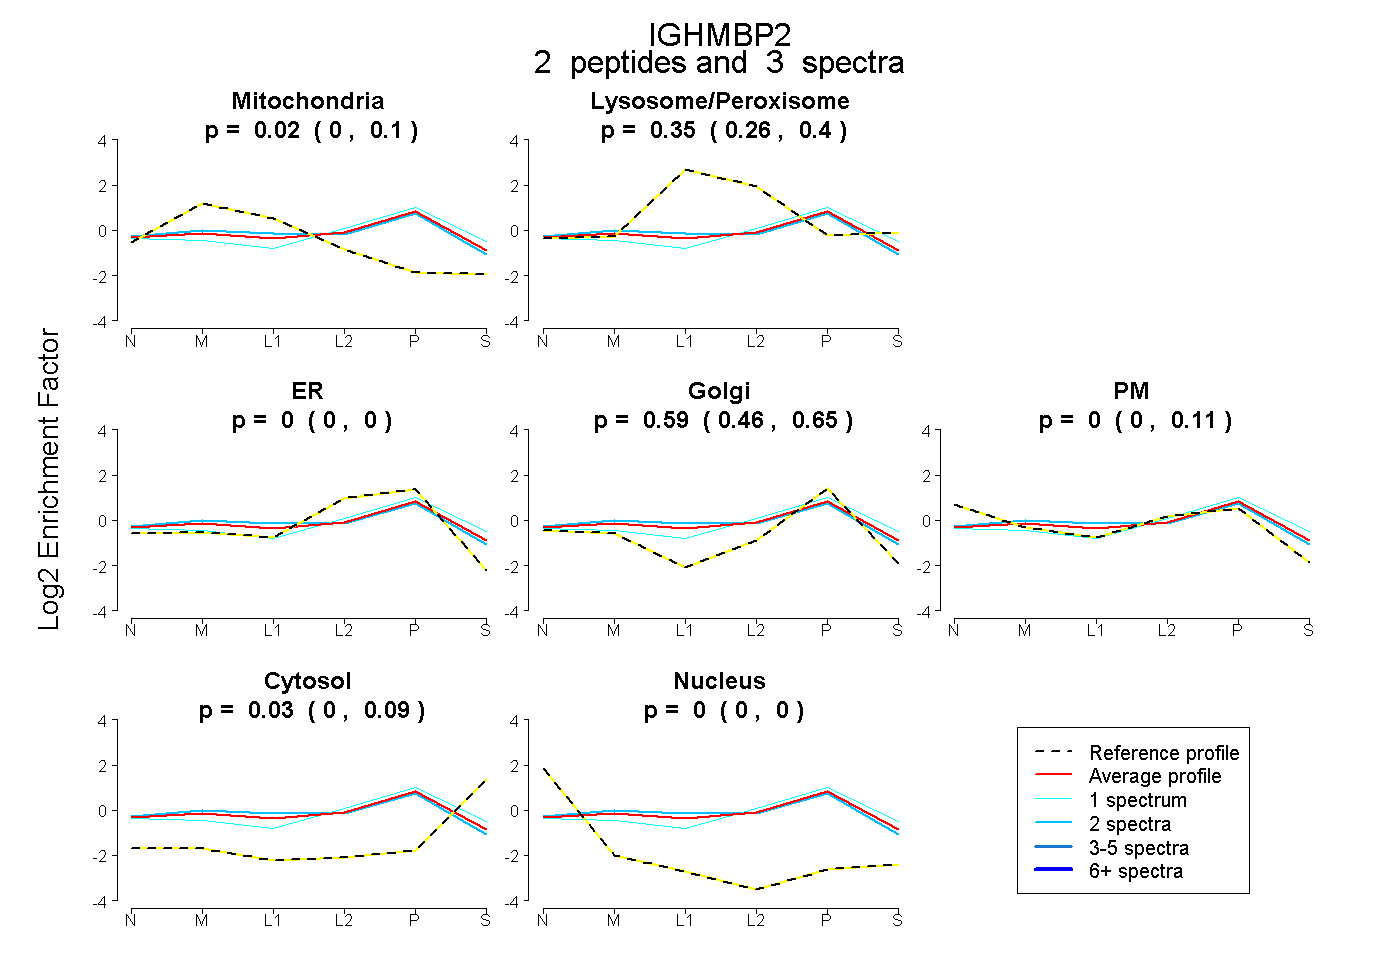
0.000 | 0.099
0.256 | 0.401
0.000 | 0.000
0.457 | 0.649
0.000 | 0.114
0.000 | 0.087
0.000 | 0.000