 2
2peptides
spectra
0.000 | 0.000
0.156 | 0.210
0.012 | 0.063
0.000 | 0.000
0.000 | 0.000
0.602 | 0.642
0.136 | 0.164
0.000 | 0.000
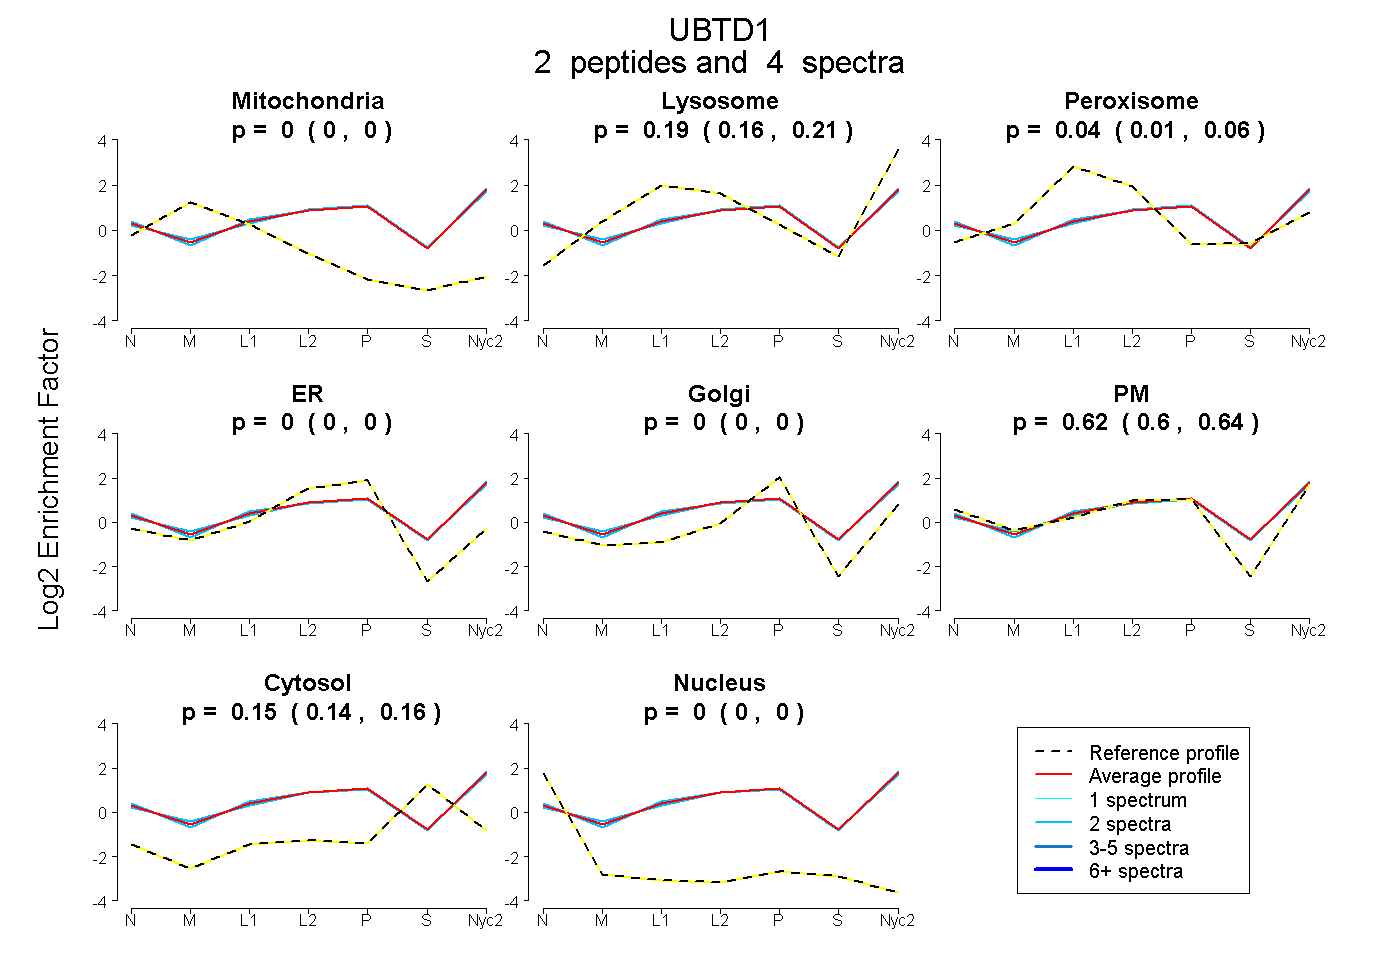
| Plot | Mito | Lyso | Perox | ER | Golgi | PM | Cytosol | Nucleus | |||||
| Expt A |
2 peptides |
4 spectra |
|
0.000 0.000 | 0.000 |
0.185 0.156 | 0.210 |
0.040 0.012 | 0.063 |
0.000 0.000 | 0.000 |
0.000 0.000 | 0.000 |
0.625 0.602 | 0.642 |
0.150 0.136 | 0.164 |
0.000 0.000 | 0.000 |