 1
1peptide
spectra
0.000 | 0.142
0.000 | 0.000
0.000 | 0.000
0.000 | 0.000
0.000 | 0.080
0.000 | 0.031
0.114 | 0.194
0.668 | 0.790
1peptide
spectra
0.020 | 1.000
0.000 | 0.979
| Plot | Mito | Lyso | Perox | ER | Golgi | PM | Cytosol | Nucleus | |||||
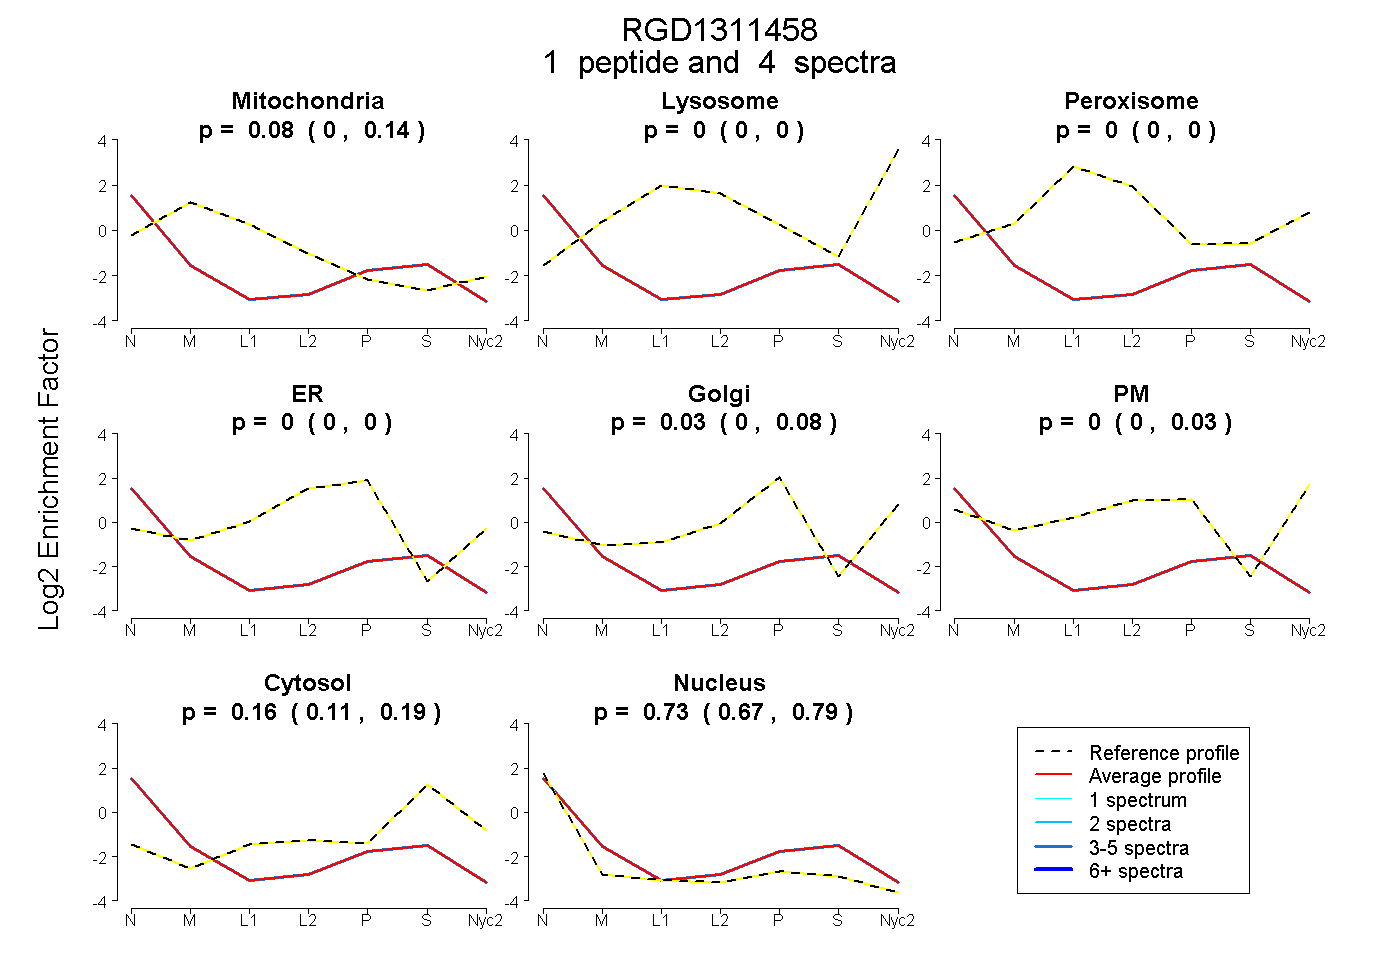
| Expt A |
1 peptide |
4 spectra |
|
0.079 0.000 | 0.142 |
0.000 0.000 | 0.000 |
0.000 0.000 | 0.000 |
0.000 0.000 | 0.000 |
0.028 0.000 | 0.080 |
0.000 0.000 | 0.031 |
0.162 0.114 | 0.194 |
0.731 0.668 | 0.790 |
||
| Plot | Lyso | Other | |||||||||||
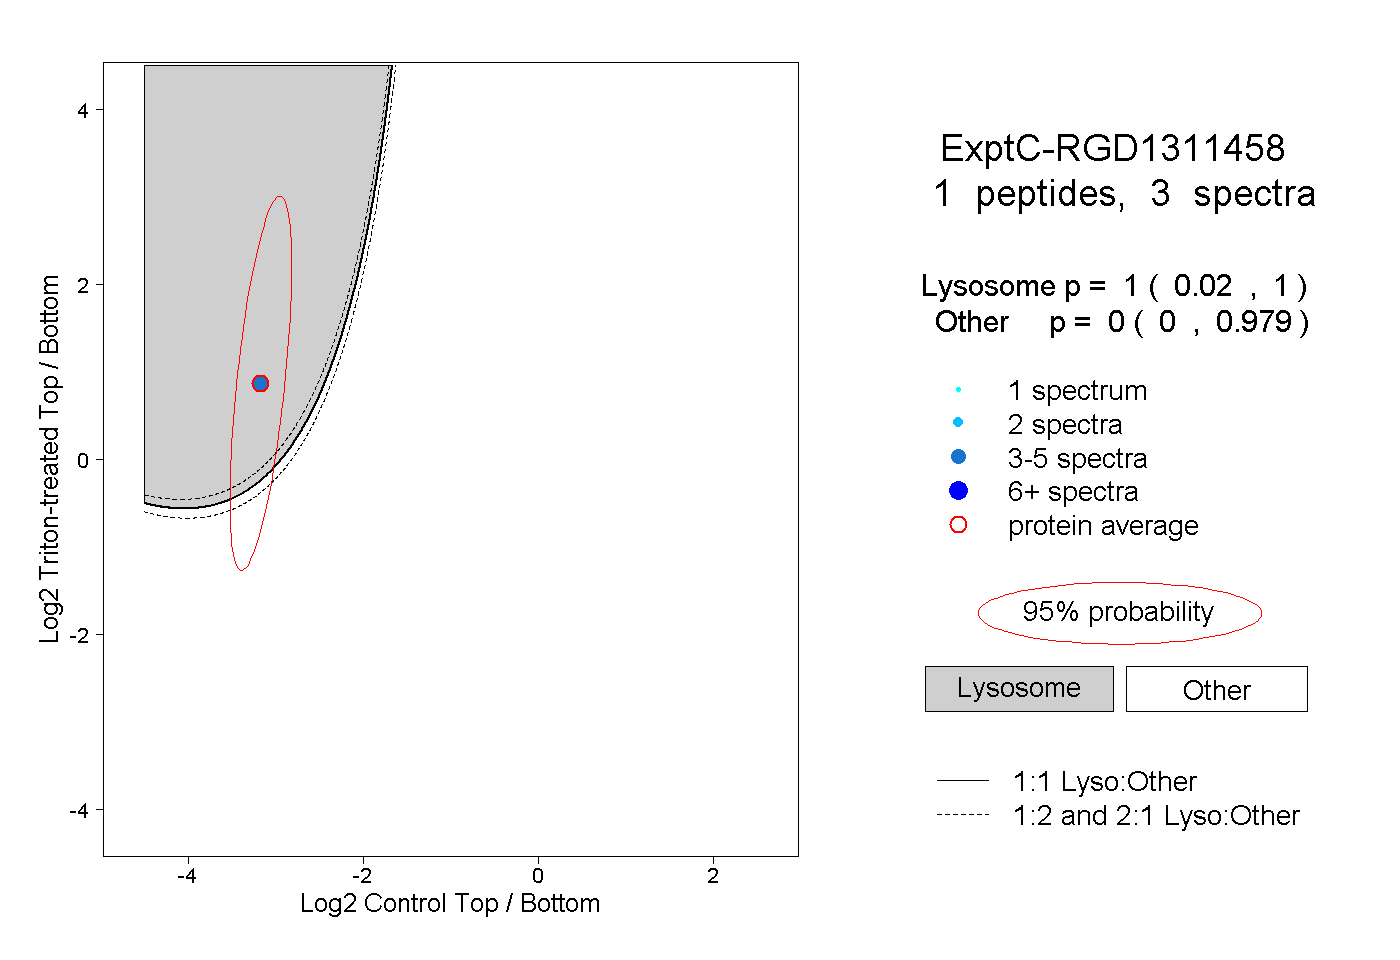
| Expt C |
1 peptide |
3 spectra |
|
1.000 0.020 | 1.000 |
0.000 0.000 | 0.979 |