 12
12peptides
spectra
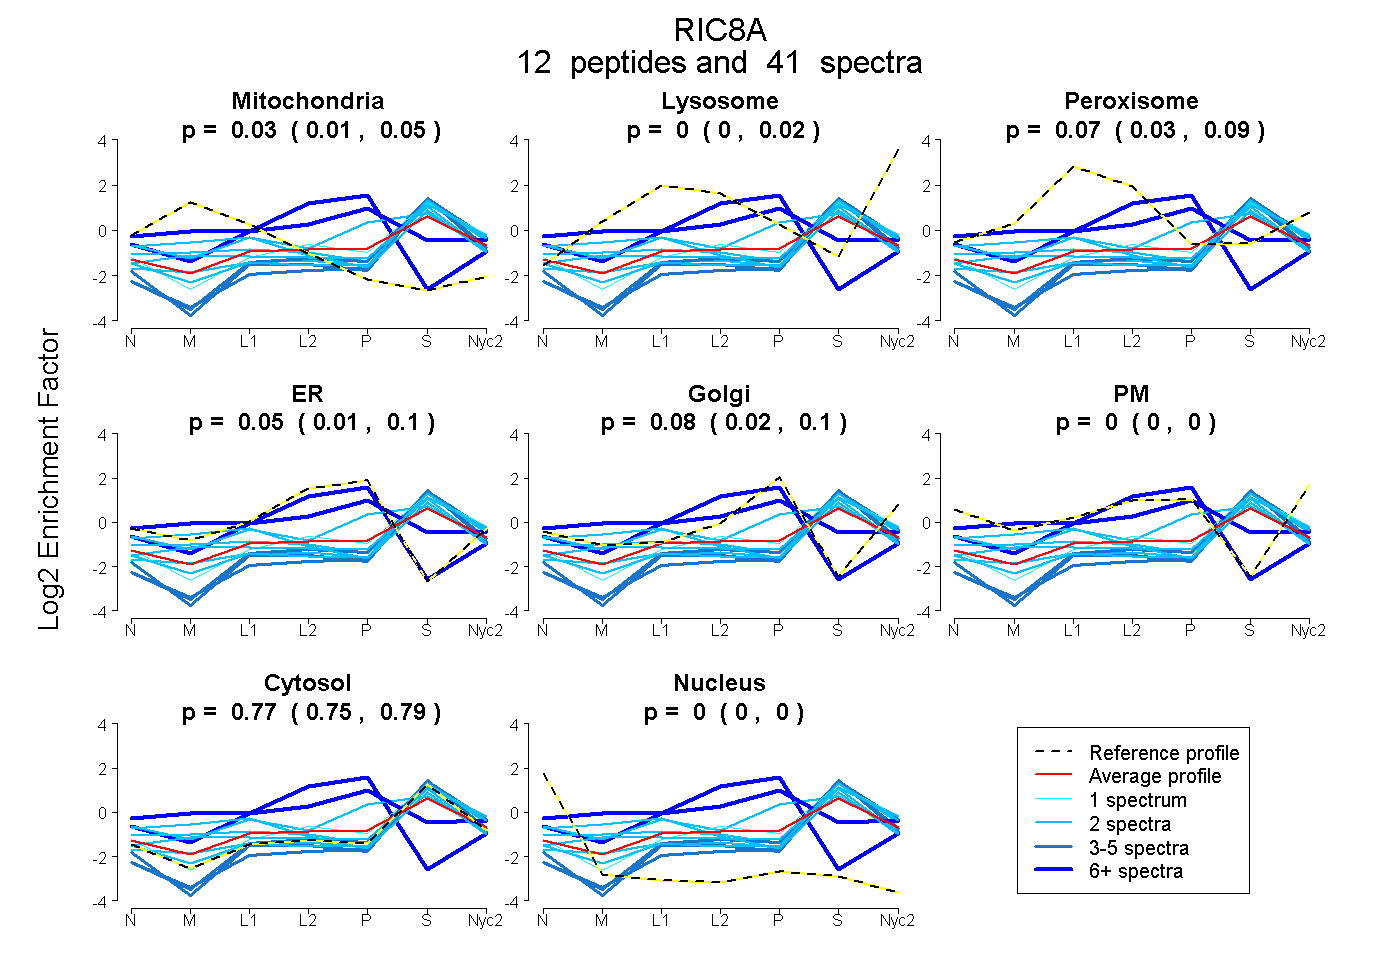
0.007 | 0.050
0.000 | 0.021
0.032 | 0.088
0.008 | 0.096
0.020 | 0.104
0.000 | 0.000
0.752 | 0.793
0.000 | 0.000
2peptides
spectra
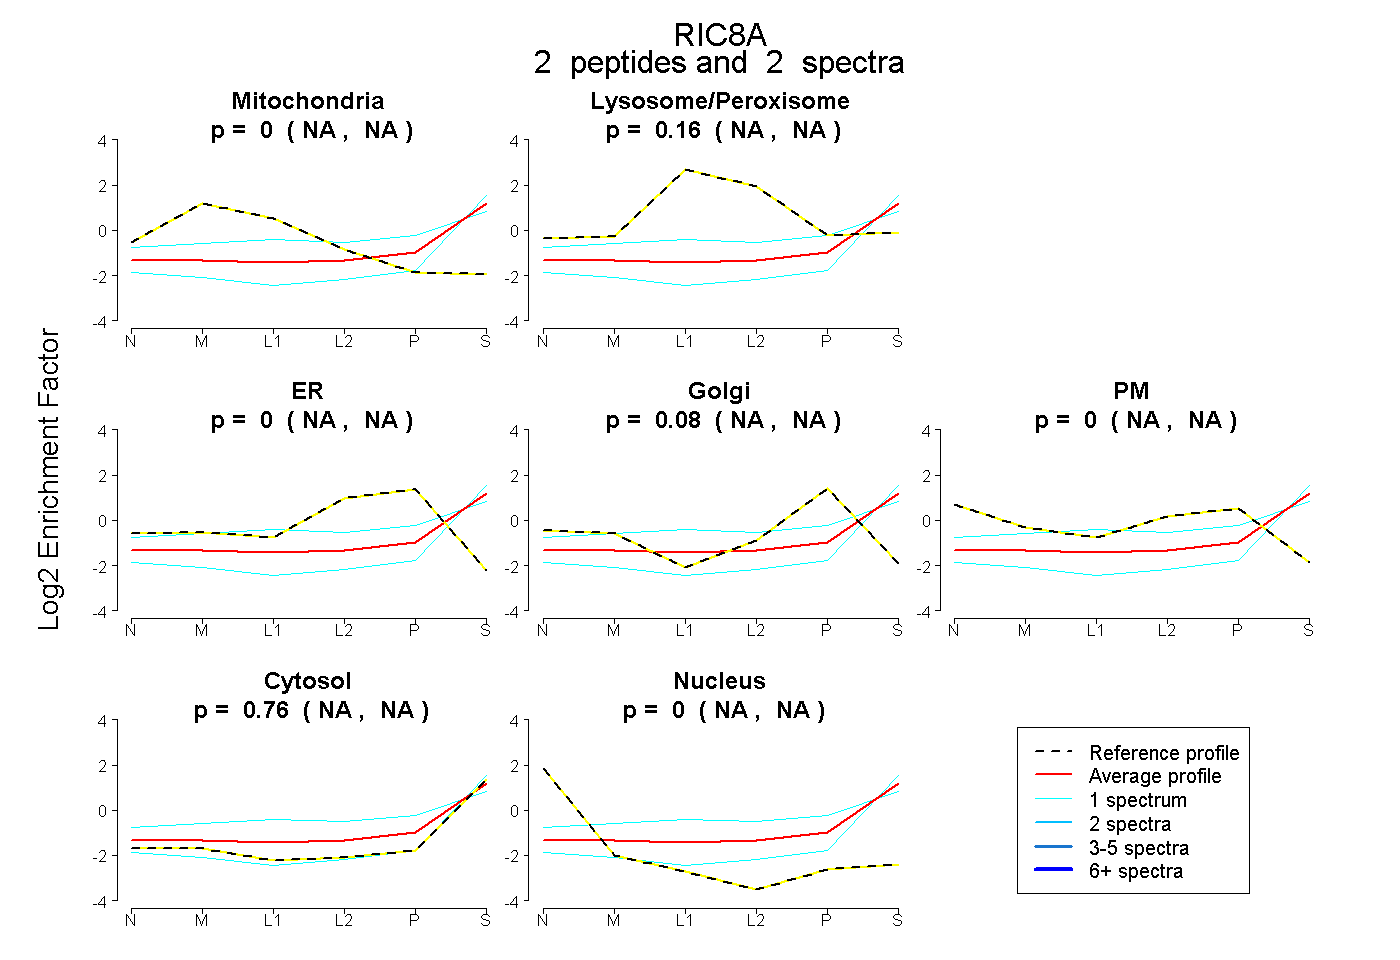
NA | NA
NA | NA
NA | NA
NA | NA
NA | NA
NA | NA
NA | NA
7peptides
spectra
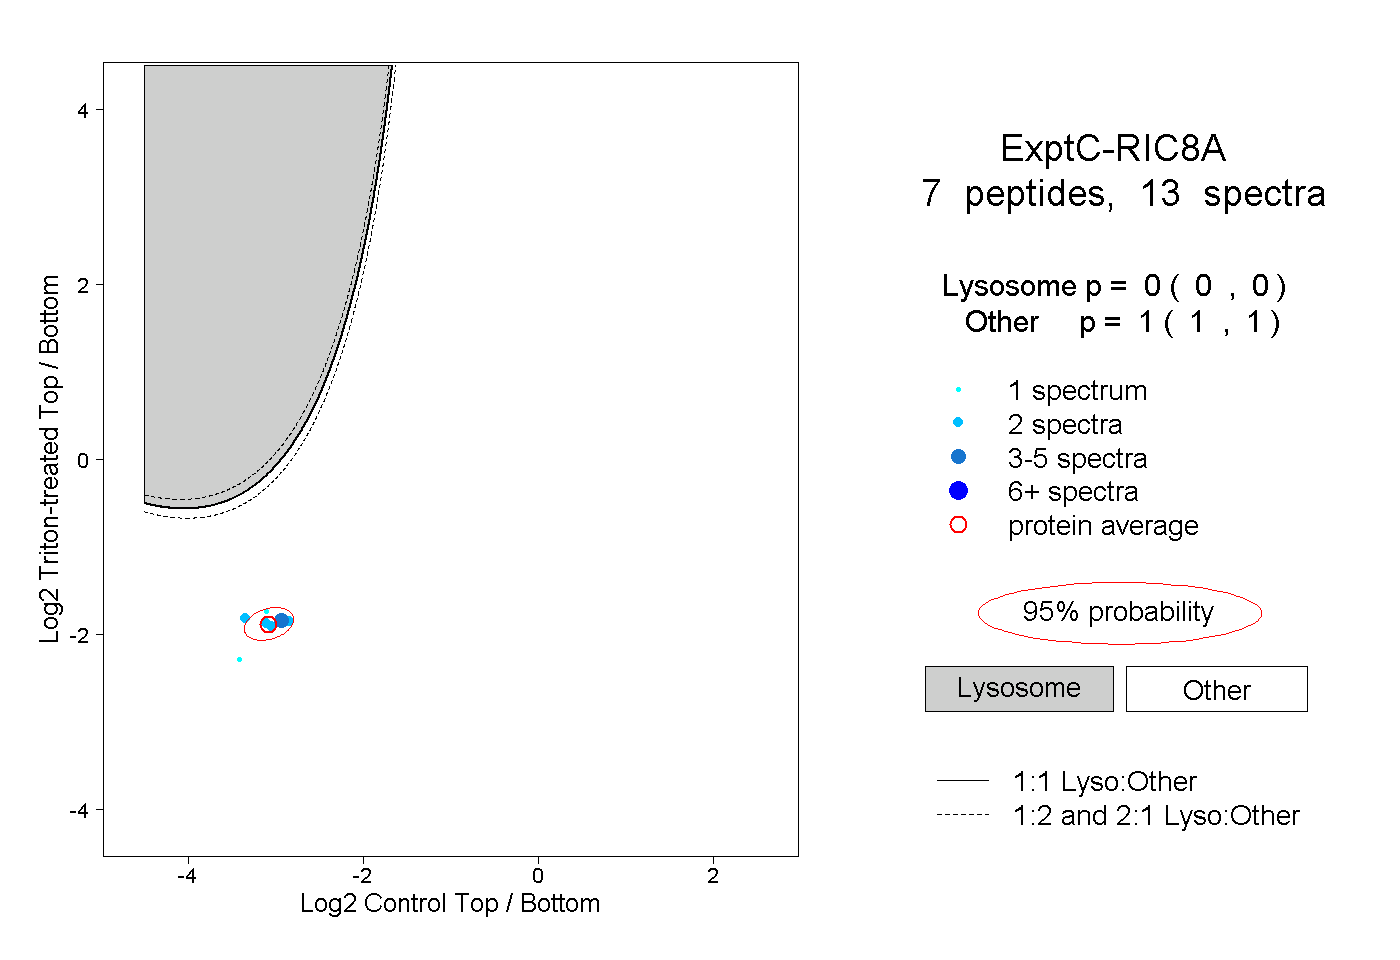
0.000 | 0.000
1.000 | 1.000