 12
12peptides
spectra
0.007 | 0.050
0.000 | 0.021
0.032 | 0.088
0.008 | 0.096
0.020 | 0.104
0.000 | 0.000
0.752 | 0.793
0.000 | 0.000
| Plot | Mito | Lyso | Perox | ER | Golgi | PM | Cytosol | Nucleus | |||||
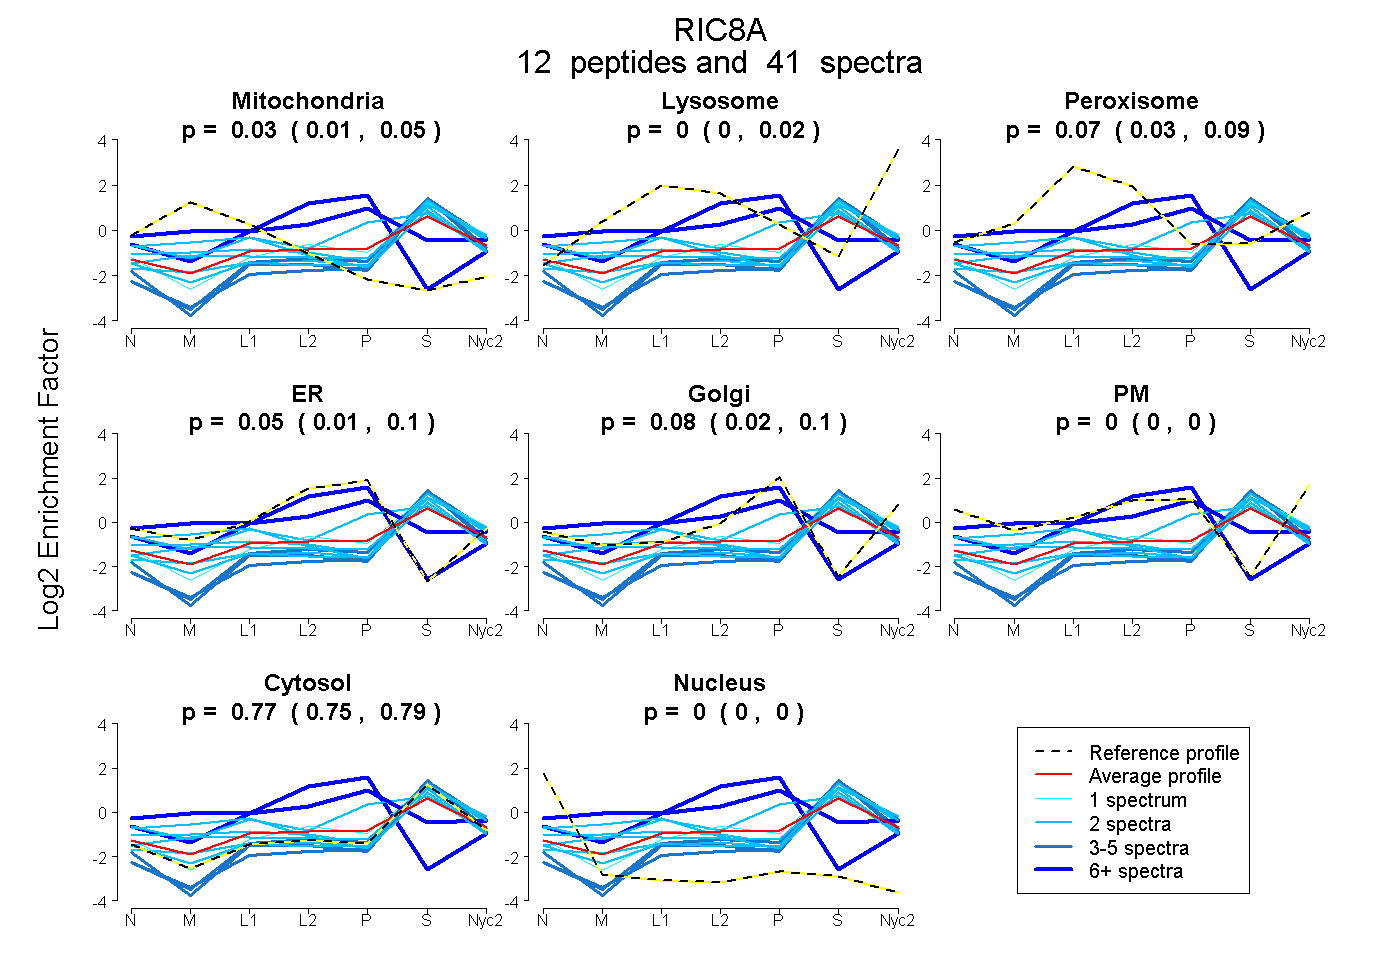
| Expt A |
12 peptides |
41 spectra |
|
0.030 0.007 | 0.050 |
0.000 0.000 | 0.021 |
0.074 0.032 | 0.088 |
0.048 0.008 | 0.096 |
0.076 0.020 | 0.104 |
0.000 0.000 | 0.000 |
0.773 0.752 | 0.793 |
0.000 0.000 | 0.000 |
| 2 spectra, EHSQSFTFDDAQQEDR | 0.001 | 0.000 | 0.146 | 0.081 | 0.170 | 0.000 | 0.602 | 0.000 | ||
| 2 spectra, YTGYGNAAGLLAAR | 0.000 | 0.028 | 0.000 | 0.000 | 0.000 | 0.000 | 0.972 | 0.000 | ||
| 2 spectra, TRPEVGDLLR | 0.248 | 0.000 | 0.135 | 0.000 | 0.000 | 0.000 | 0.617 | 0.000 | ||
| 4 spectra, EVDEEDAALYR | 0.000 | 0.000 | 0.000 | 0.000 | 0.000 | 0.000 | 1.000 | 0.000 | ||
| 1 spectrum, LVNMFDK | 0.000 | 0.088 | 0.000 | 0.000 | 0.000 | 0.026 | 0.886 | 0.000 | ||
| 4 spectra, AQVLPPLR | 0.000 | 0.000 | 0.000 | 0.000 | 0.000 | 0.000 | 1.000 | 0.000 | ||
| 6 spectra, QQLFQELHGVR | 0.074 | 0.000 | 0.219 | 0.228 | 0.250 | 0.000 | 0.230 | 0.000 | ||
| 11 spectra, AMELLK | 0.000 | 0.000 | 0.000 | 0.886 | 0.000 | 0.000 | 0.052 | 0.063 | ||
| 2 spectra, ENPLVILPAQETER | 0.028 | 0.045 | 0.000 | 0.000 | 0.000 | 0.000 | 0.928 | 0.000 | ||
| 2 spectra, YLGTLLR | 0.079 | 0.126 | 0.000 | 0.000 | 0.000 | 0.000 | 0.795 | 0.000 | ||
| 2 spectra, ASINPVTGR | 0.161 | 0.000 | 0.098 | 0.000 | 0.000 | 0.000 | 0.741 | 0.000 | ||
| 3 spectra, LIQPMGMSPR | 0.000 | 0.000 | 0.000 | 0.000 | 0.000 | 0.000 | 1.000 | 0.000 |
| Plot | Mito | Lyso or Perox | ER | Golgi | PM | Cytosol | Nucleus | ||||||
| Expt B |
2 peptides |
2 spectra |
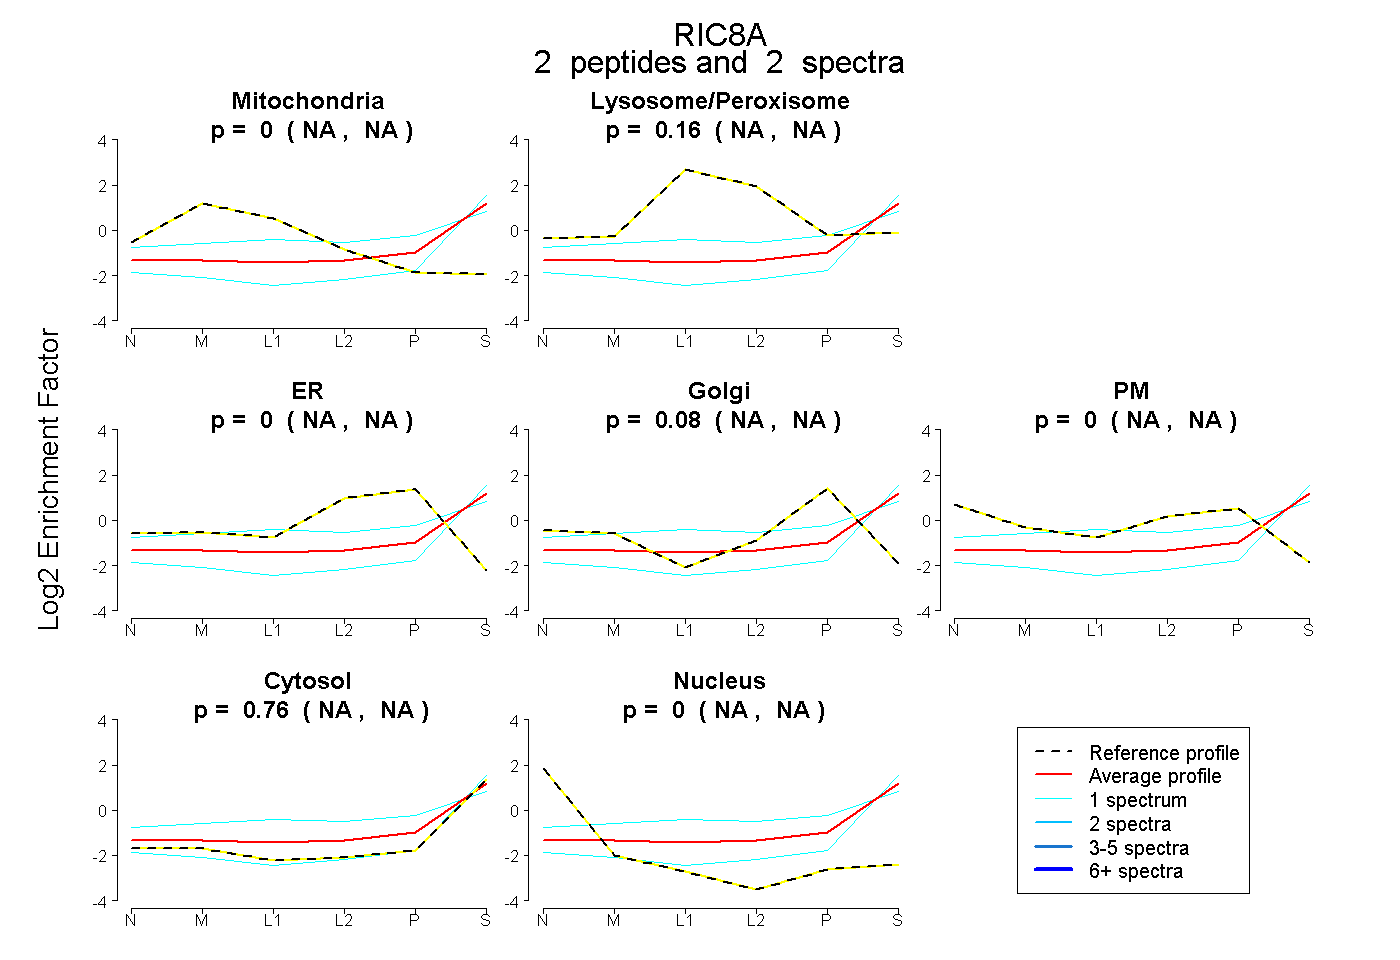 |
0.000 NA | NA |
0.162 NA | NA |
0.000 NA | NA |
0.079 NA | NA |
0.000 NA | NA |
0.759 NA | NA |
0.000 NA | NA |
|||
| Plot | Lyso | Other | |||||||||||
| Expt C |
7 peptides |
13 spectra |
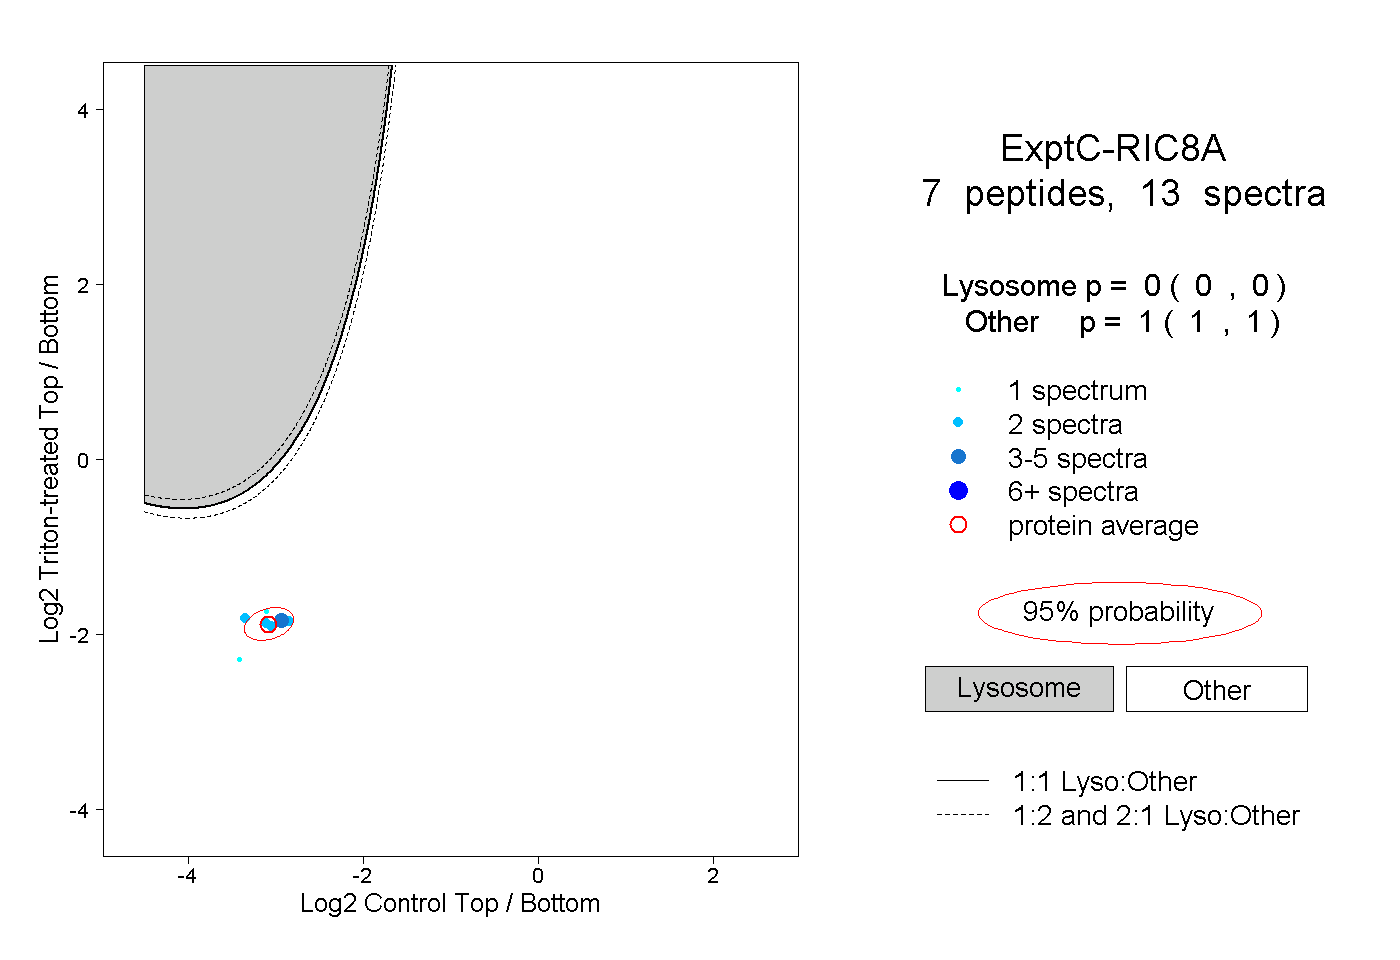 |
0.000 0.000 | 0.000 |
1.000 1.000 | 1.000 |