SEC61A1
[ENSRNOP00000018455]
Main page
| | | Plot |
Mito |
Lyso |
|
Perox |
ER |
Golgi |
PM |
Cytosol |
Nucleus |
|
| Expt A |
 8
8
peptides |
106
spectra |
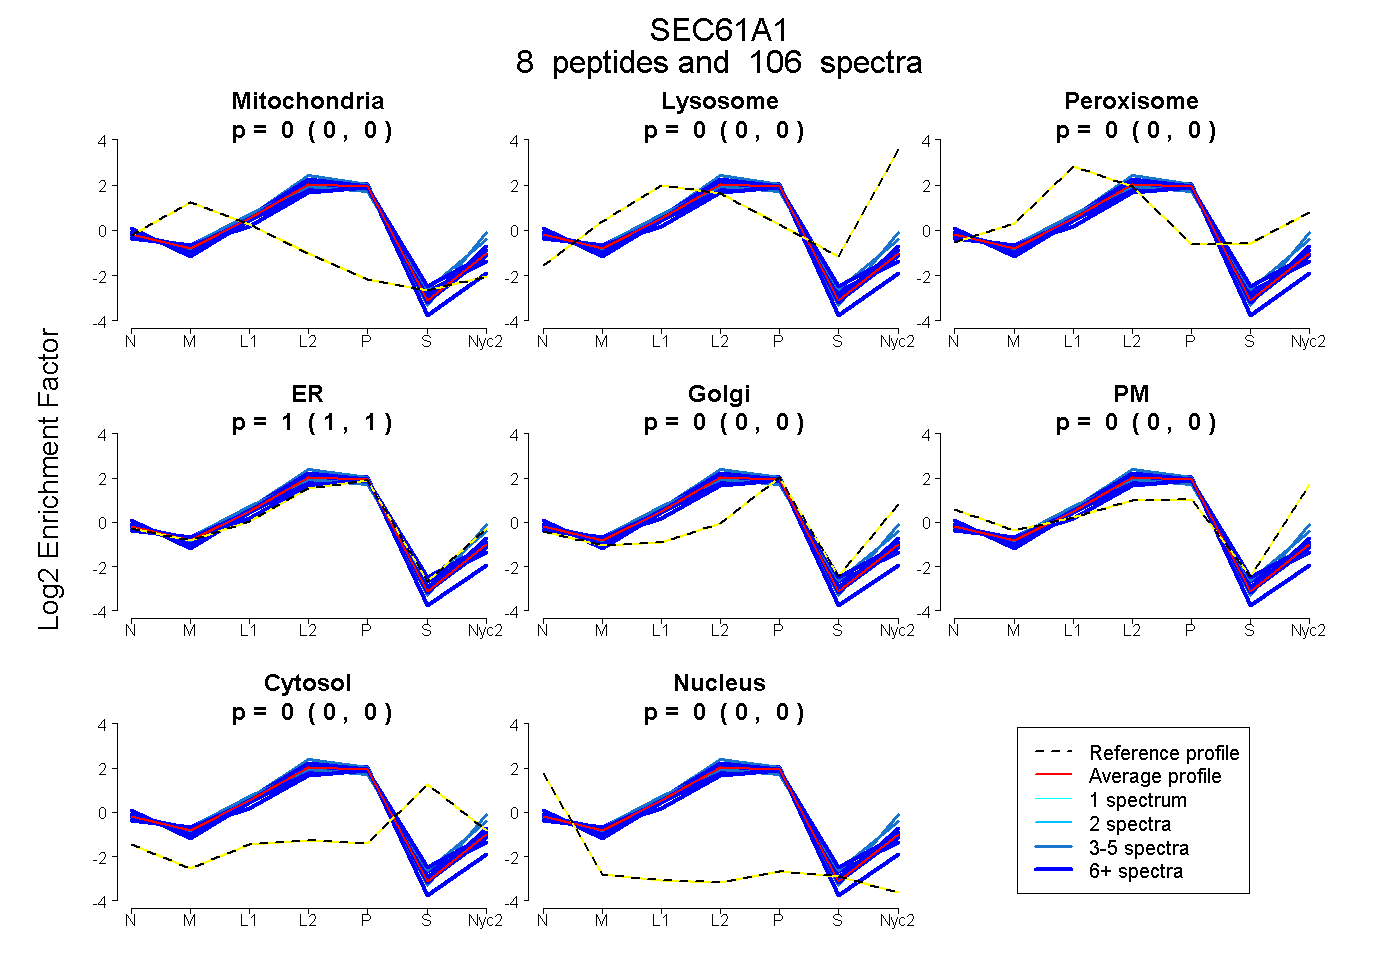 |
0.001
0.000 | 0.004 |
0.000
0.000 | 0.000 |
|
0.000
0.000 | 0.000 |
0.999
0.996 | 1.000 |
0.000
0.000 | 0.000 |
0.000
0.000 | 0.000 |
0.000
0.000 | 0.000 |
0.000
0.000 | 0.000 |
|
| | | Plot |
Mito |
|
Lyso or Perox |
|
ER |
Golgi |
PM |
Cytosol |
Nucleus |
|
| Expt B |
6
peptides |
48
spectra |
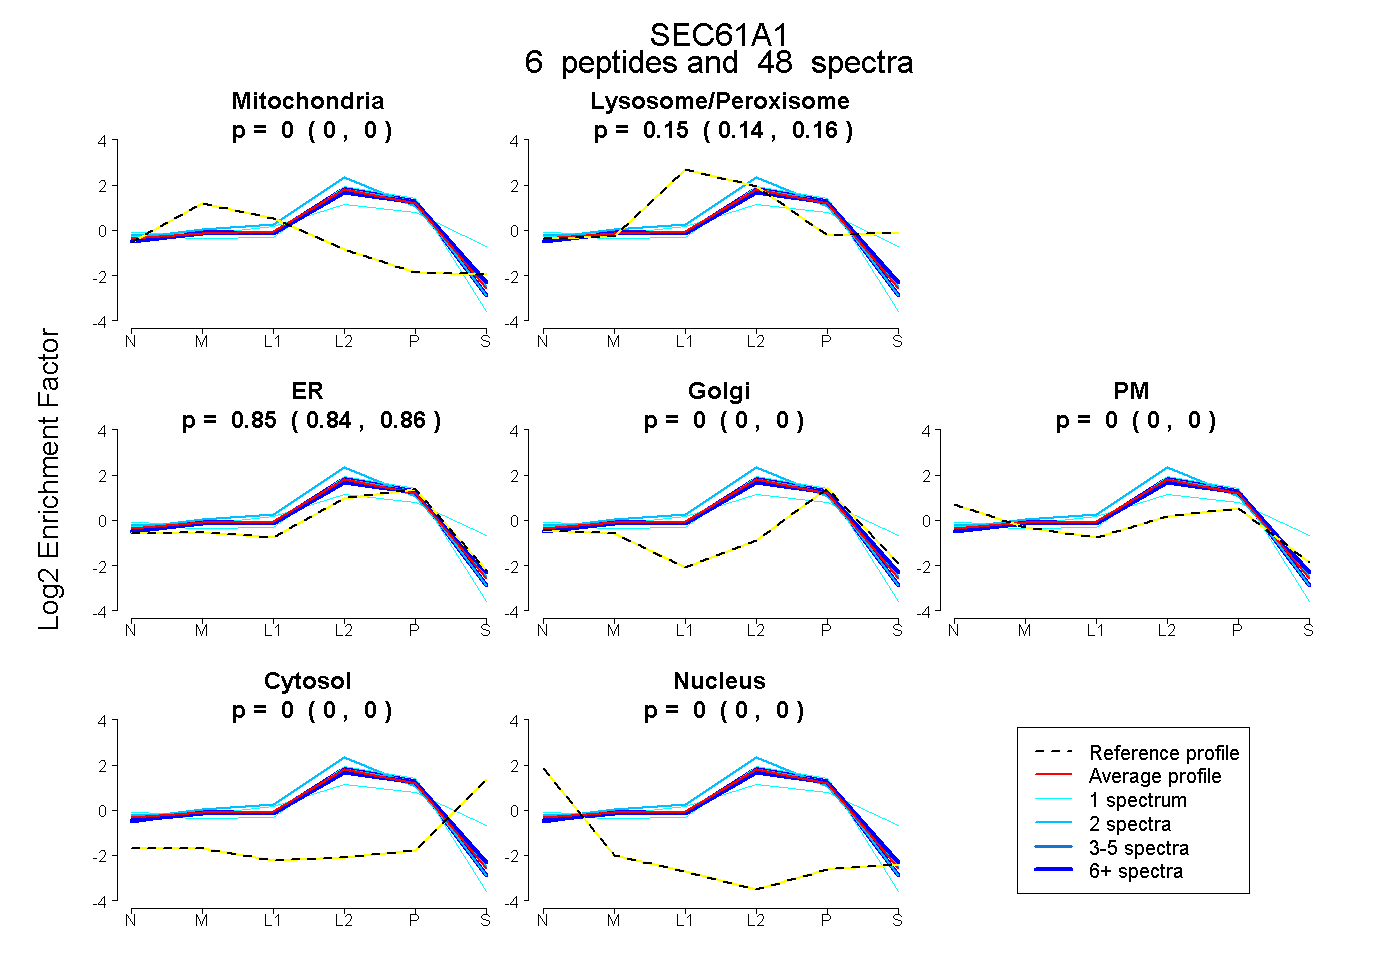 |
0.000
0.000 | 0.000 |
|
0.151
0.143 | 0.158 |
|
0.849
0.841 | 0.856 |
0.000
0.000 | 0.000 |
0.000
0.000 | 0.000 |
0.000
0.000 | 0.000 |
0.000
0.000 | 0.000 |
|
| 1 spectrum, EQQMVMR |
0.000 |
|
0.432 |
|
0.204 |
0.207 |
0.148 |
0.008 |
0.000 |
|
| 25 spectra, VILASNR |
0.000 |
|
0.148 |
|
0.852 |
0.000 |
0.000 |
0.000 |
0.000 |
|
| 2 spectra, IIEVGDTPK |
0.000 |
|
0.112 |
|
0.888 |
0.000 |
0.000 |
0.000 |
0.000 |
|
| 17 spectra, AFSPTTVNTGR |
0.000 |
|
0.096 |
|
0.904 |
0.000 |
0.000 |
0.000 |
0.000 |
|
| 1 spectrum, GQYNTYPIK |
0.000 |
|
0.000 |
|
1.000 |
0.000 |
0.000 |
0.000 |
0.000 |
|
| 2 spectra, ETSMVHELNR |
0.000 |
|
0.248 |
|
0.752 |
0.000 |
0.000 |
0.000 |
0.000 |
|
| | | Plot |
|
Lyso |
|
|
|
|
|
|
|
Other |
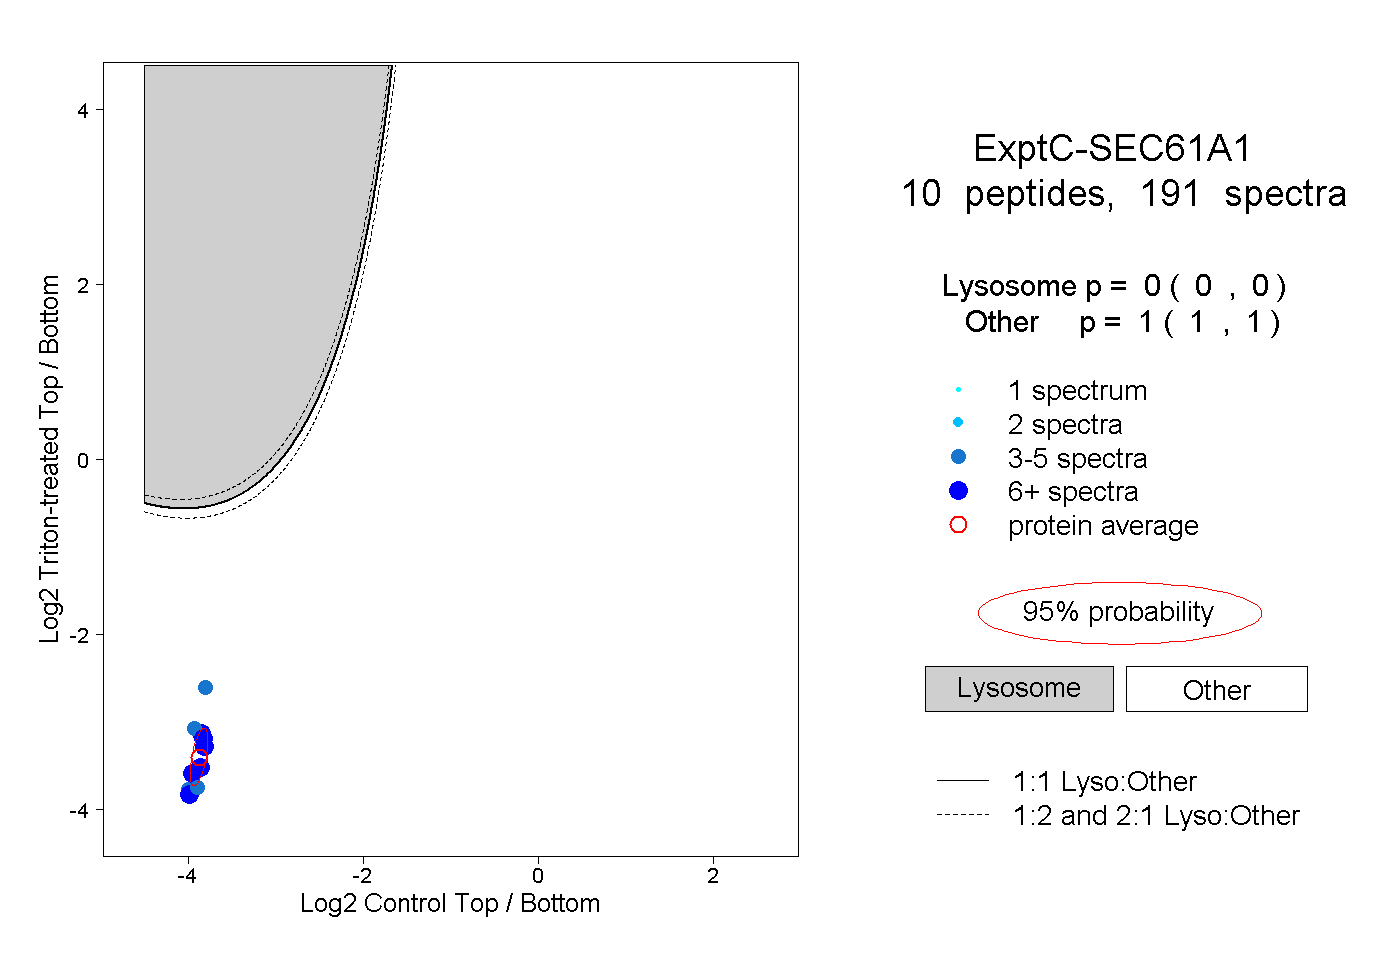
| Expt C |
10
peptides |
191
spectra |
 |
|
0.000
0.000 | 0.000 |
|
|
|
|
|
|
|
1.000
1.000 | 1.000 |
| | | Plot |
|
Lyso |
|
|
|
|
|
|
|
Other |
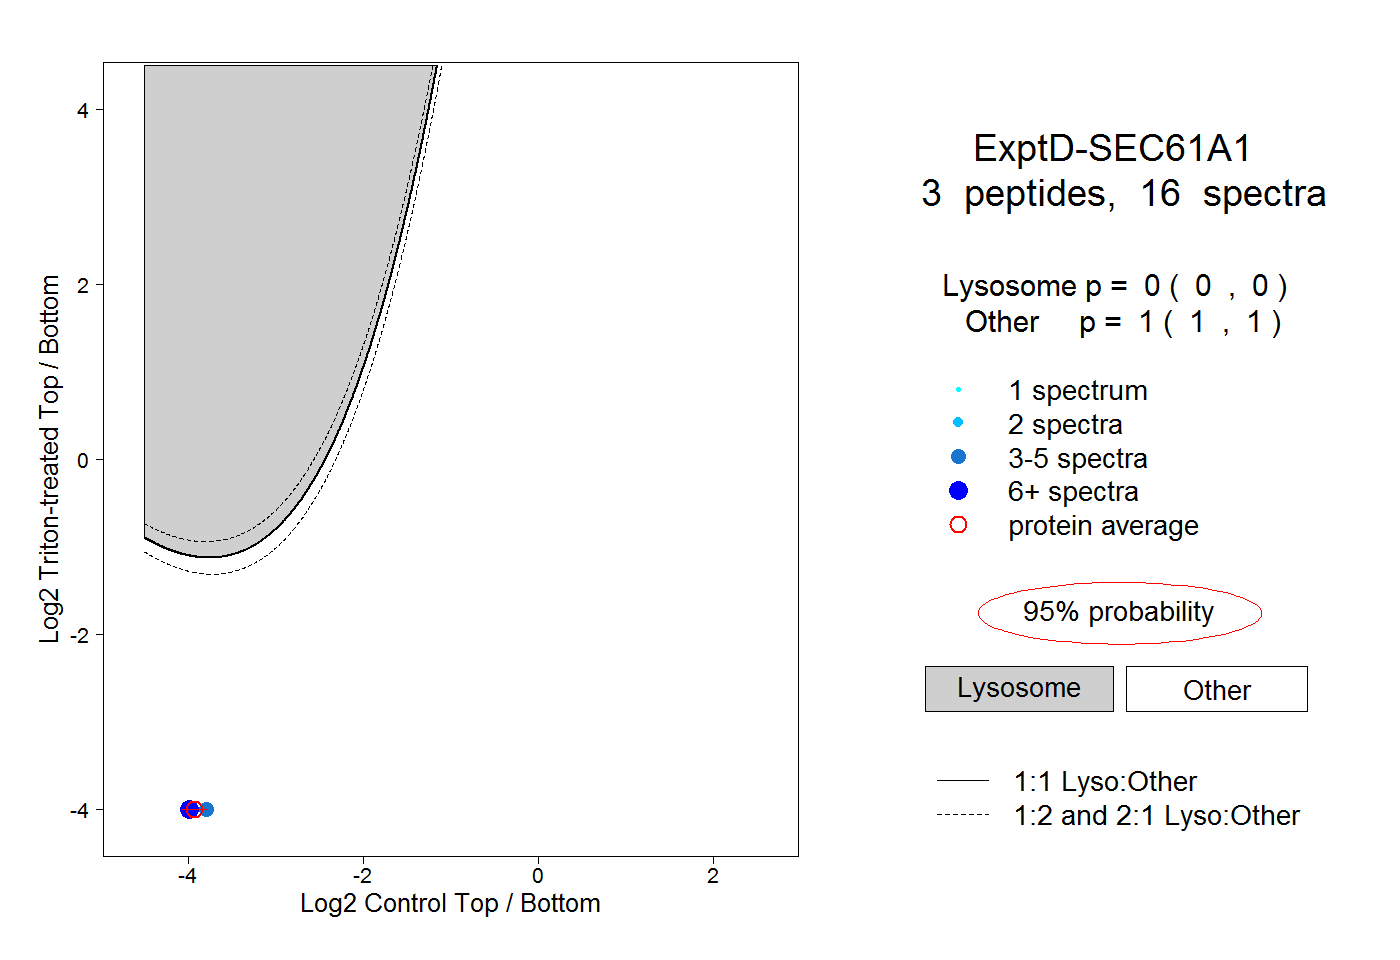
| Expt D |
3
peptides |
16
spectra |
 |
|
0.000
0.000 | 0.000 |
|
|
|
|
|
|
|
1.000
1.000 | 1.000 |