 8
8peptides
spectra
0.000 | 0.004
0.000 | 0.000
0.000 | 0.000
0.996 | 1.000
0.000 | 0.000
0.000 | 0.000
0.000 | 0.000
0.000 | 0.000
| Plot | Mito | Lyso | Perox | ER | Golgi | PM | Cytosol | Nucleus | |||||
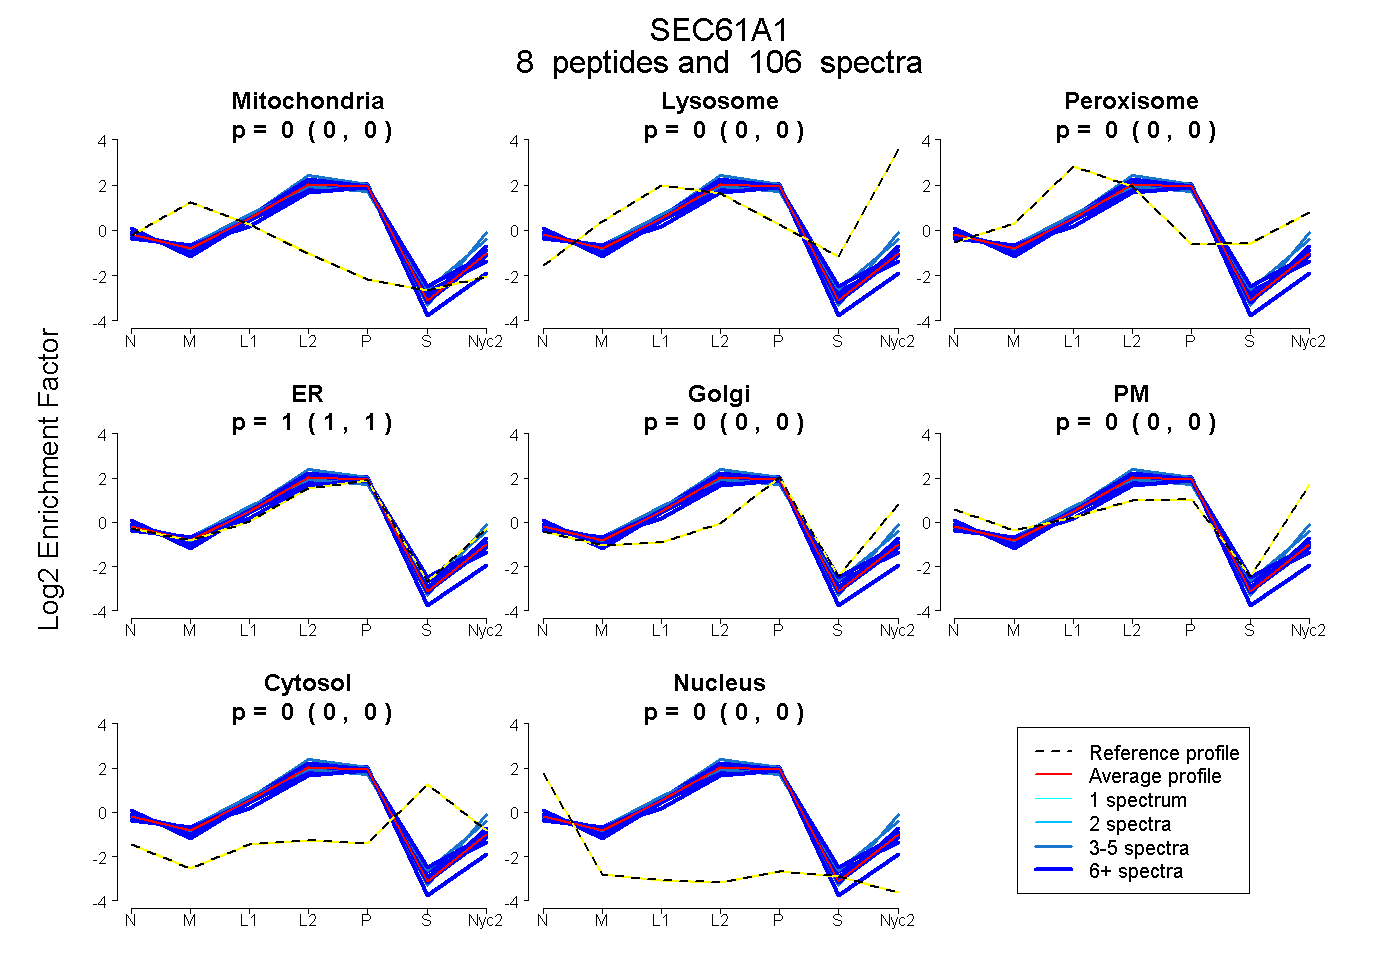
| Expt A |
8 peptides |
106 spectra |
|
0.001 0.000 | 0.004 |
0.000 0.000 | 0.000 |
0.000 0.000 | 0.000 |
0.999 0.996 | 1.000 |
0.000 0.000 | 0.000 |
0.000 0.000 | 0.000 |
0.000 0.000 | 0.000 |
0.000 0.000 | 0.000 |
| 10 spectra, EQQMVMR | 0.000 | 0.000 | 0.014 | 0.986 | 0.000 | 0.000 | 0.000 | 0.000 | ||
| 6 spectra, VDLPIK | 0.048 | 0.000 | 0.000 | 0.952 | 0.000 | 0.000 | 0.000 | 0.000 | ||
| 36 spectra, VILASNR | 0.004 | 0.000 | 0.000 | 0.996 | 0.000 | 0.000 | 0.000 | 0.000 | ||
| 3 spectra, IIEVGDTPK | 0.000 | 0.000 | 0.119 | 0.881 | 0.000 | 0.000 | 0.000 | 0.000 | ||
| 33 spectra, AFSPTTVNTGR | 0.025 | 0.000 | 0.000 | 0.975 | 0.000 | 0.000 | 0.000 | 0.000 | ||
| 3 spectra, ALFNGAQK | 0.000 | 0.023 | 0.000 | 0.977 | 0.000 | 0.000 | 0.000 | 0.000 | ||
| 7 spectra, GQYNTYPIK | 0.023 | 0.000 | 0.000 | 0.961 | 0.000 | 0.000 | 0.000 | 0.016 | ||
| 8 spectra, ETSMVHELNR | 0.000 | 0.000 | 0.000 | 0.982 | 0.000 | 0.000 | 0.000 | 0.018 |
| Plot | Mito | Lyso or Perox | ER | Golgi | PM | Cytosol | Nucleus | ||||||
| Expt B |
6 peptides |
48 spectra |
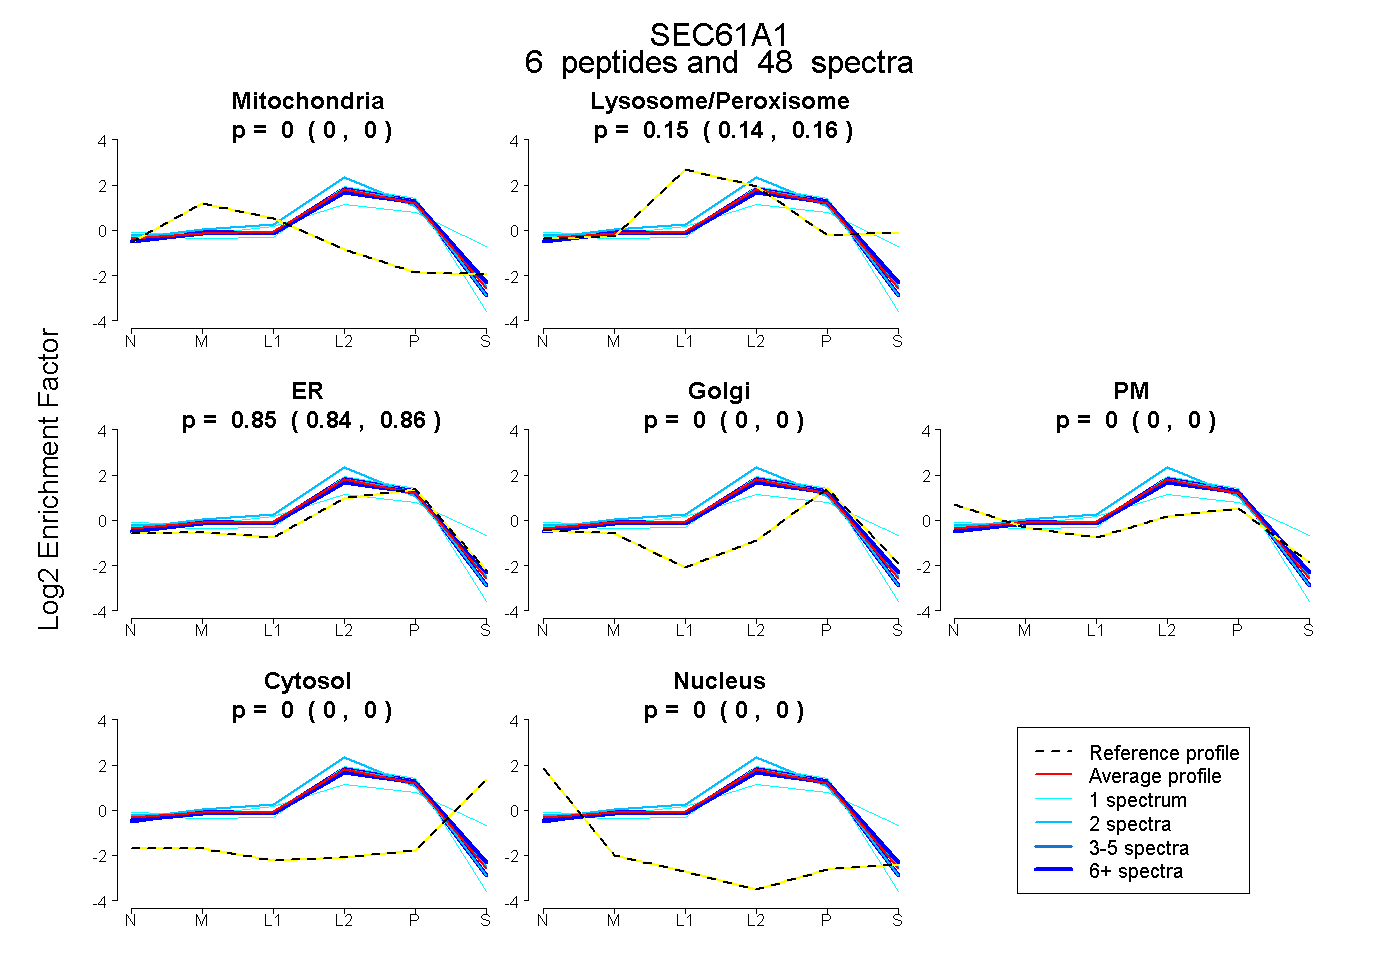 |
0.000 0.000 | 0.000 |
0.151 0.143 | 0.158 |
0.849 0.841 | 0.856 |
0.000 0.000 | 0.000 |
0.000 0.000 | 0.000 |
0.000 0.000 | 0.000 |
0.000 0.000 | 0.000 |
|||
| Plot | Lyso | Other | |||||||||||
| Expt C |
10 peptides |
191 spectra |
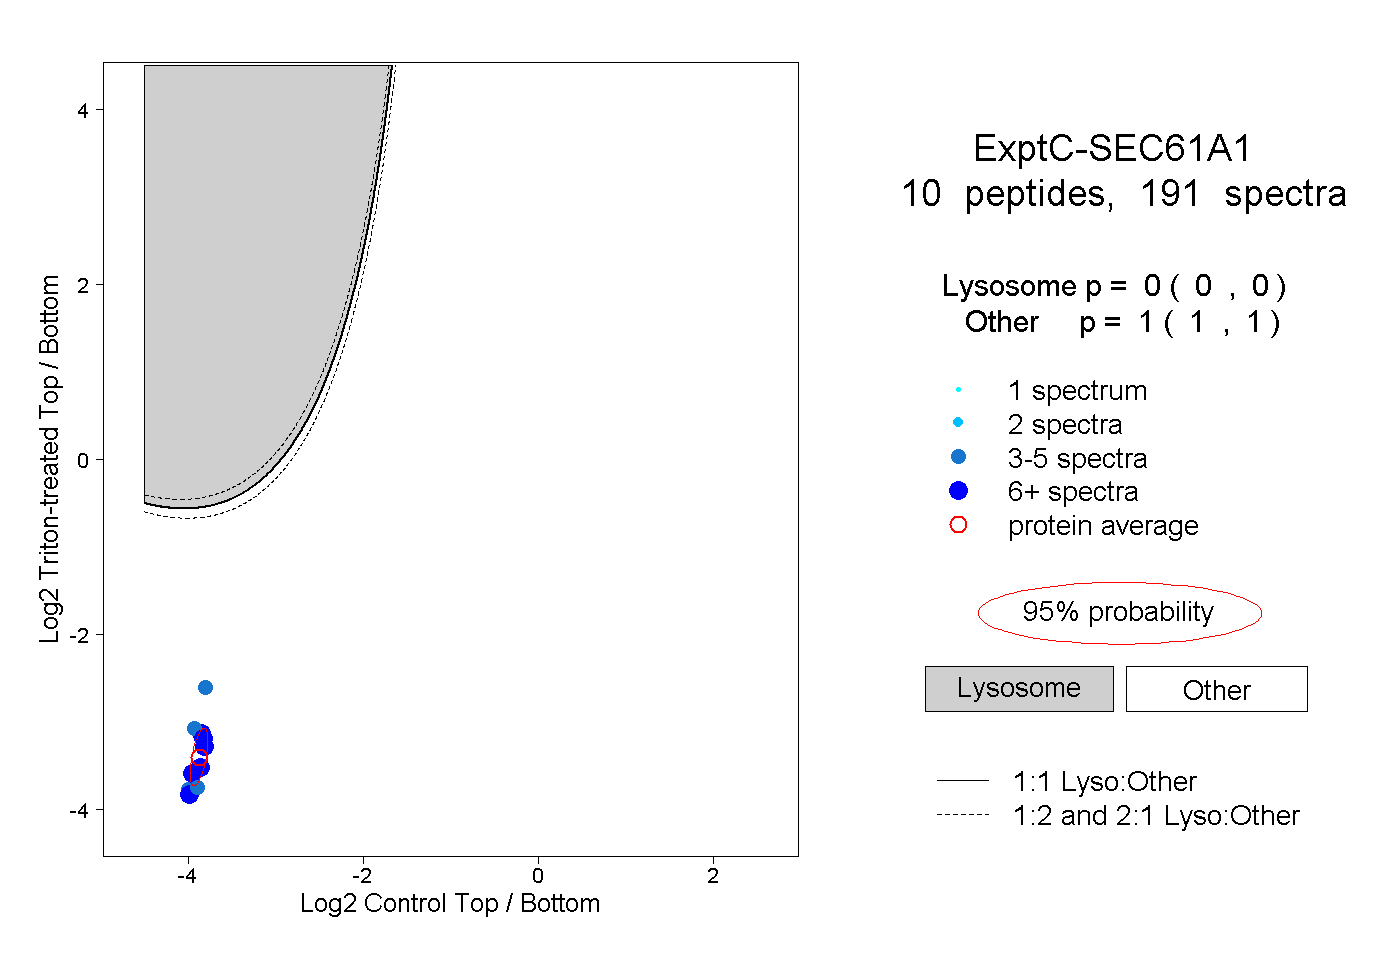 |
0.000 0.000 | 0.000 |
1.000 1.000 | 1.000 |
||||||||
| Plot | Lyso | Other | |||||||||||
| Expt D |
3 peptides |
16 spectra |
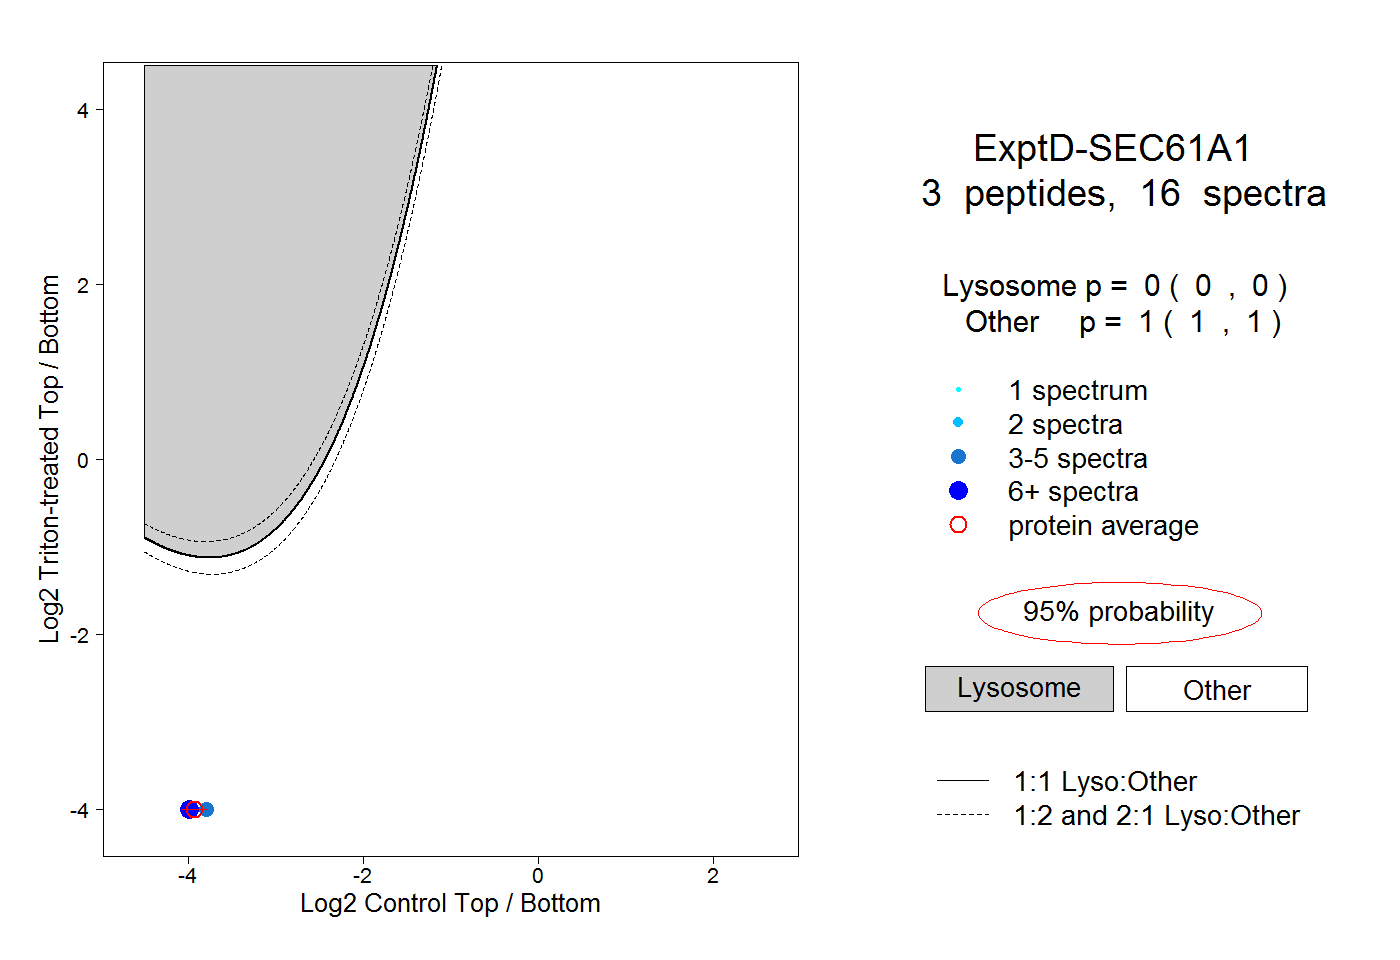 |
0.000 0.000 | 0.000 |
1.000 1.000 | 1.000 |