 4
4peptides
spectra
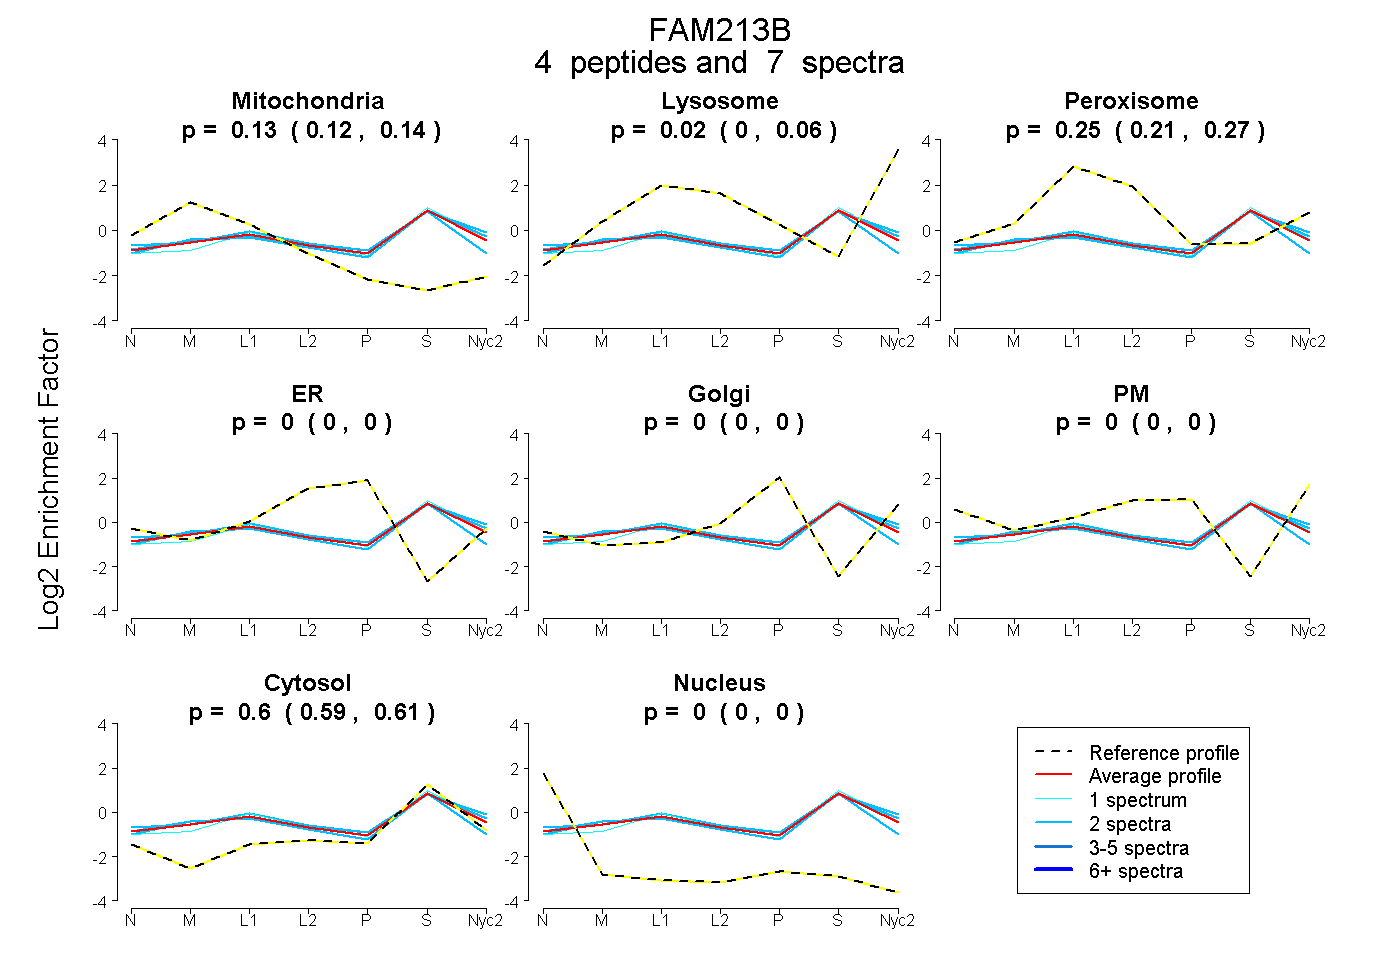
0.121 | 0.143
0.000 | 0.056
0.213 | 0.266
0.000 | 0.000
0.000 | 0.000
0.000 | 0.000
0.589 | 0.606
0.000 | 0.000
3peptides
spectra
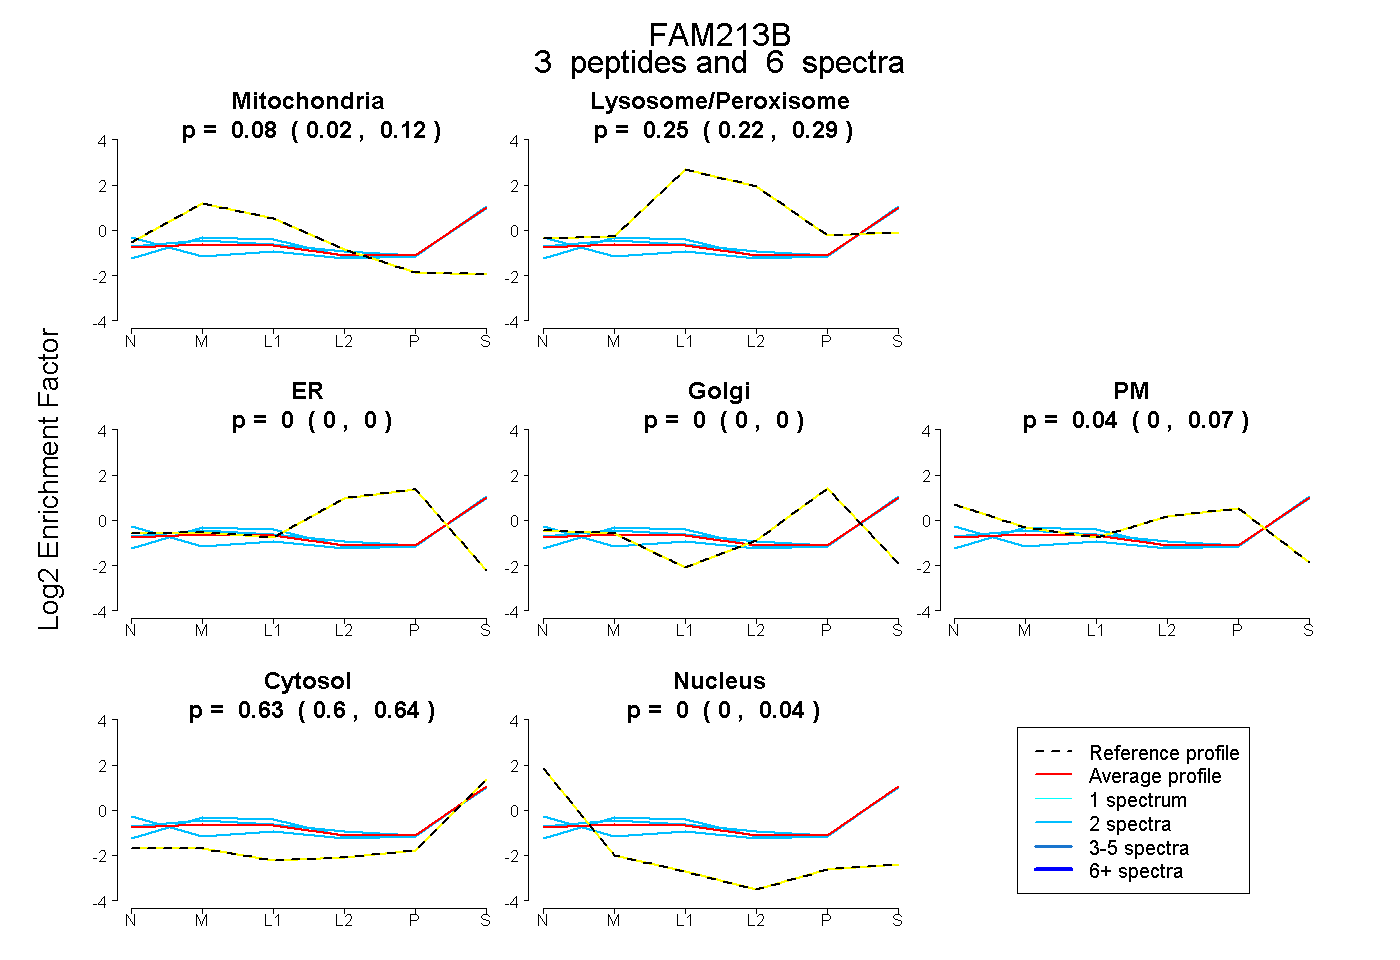
0.018 | 0.117
0.223 | 0.287
0.000 | 0.000
0.000 | 0.000
0.001 | 0.067
0.596 | 0.644
0.000 | 0.036
6peptides
spectra
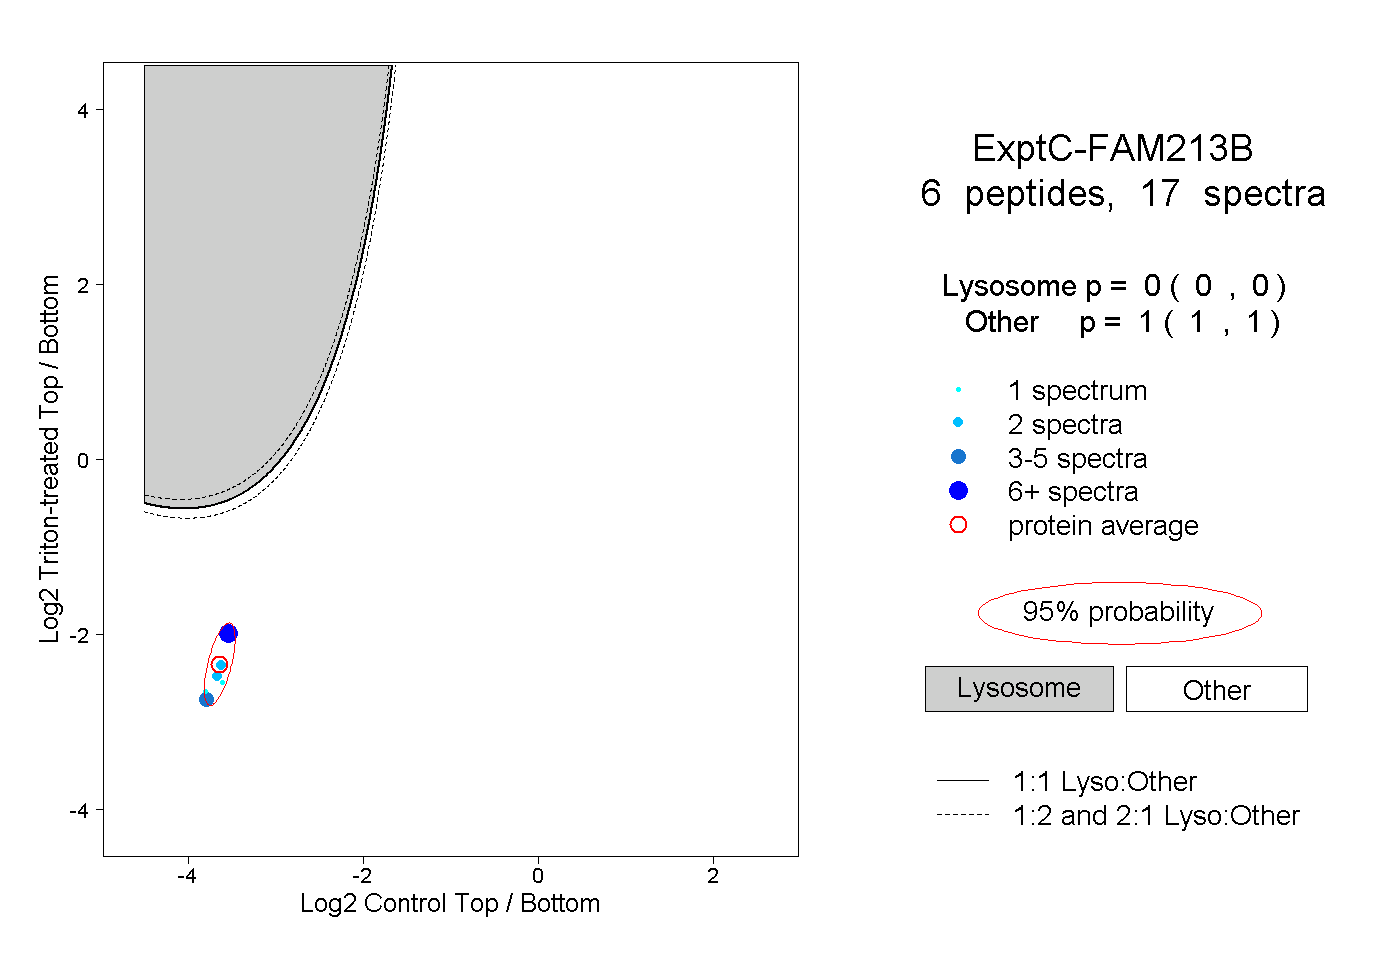
0.000 | 0.000
1.000 | 1.000
1peptide
spectrum
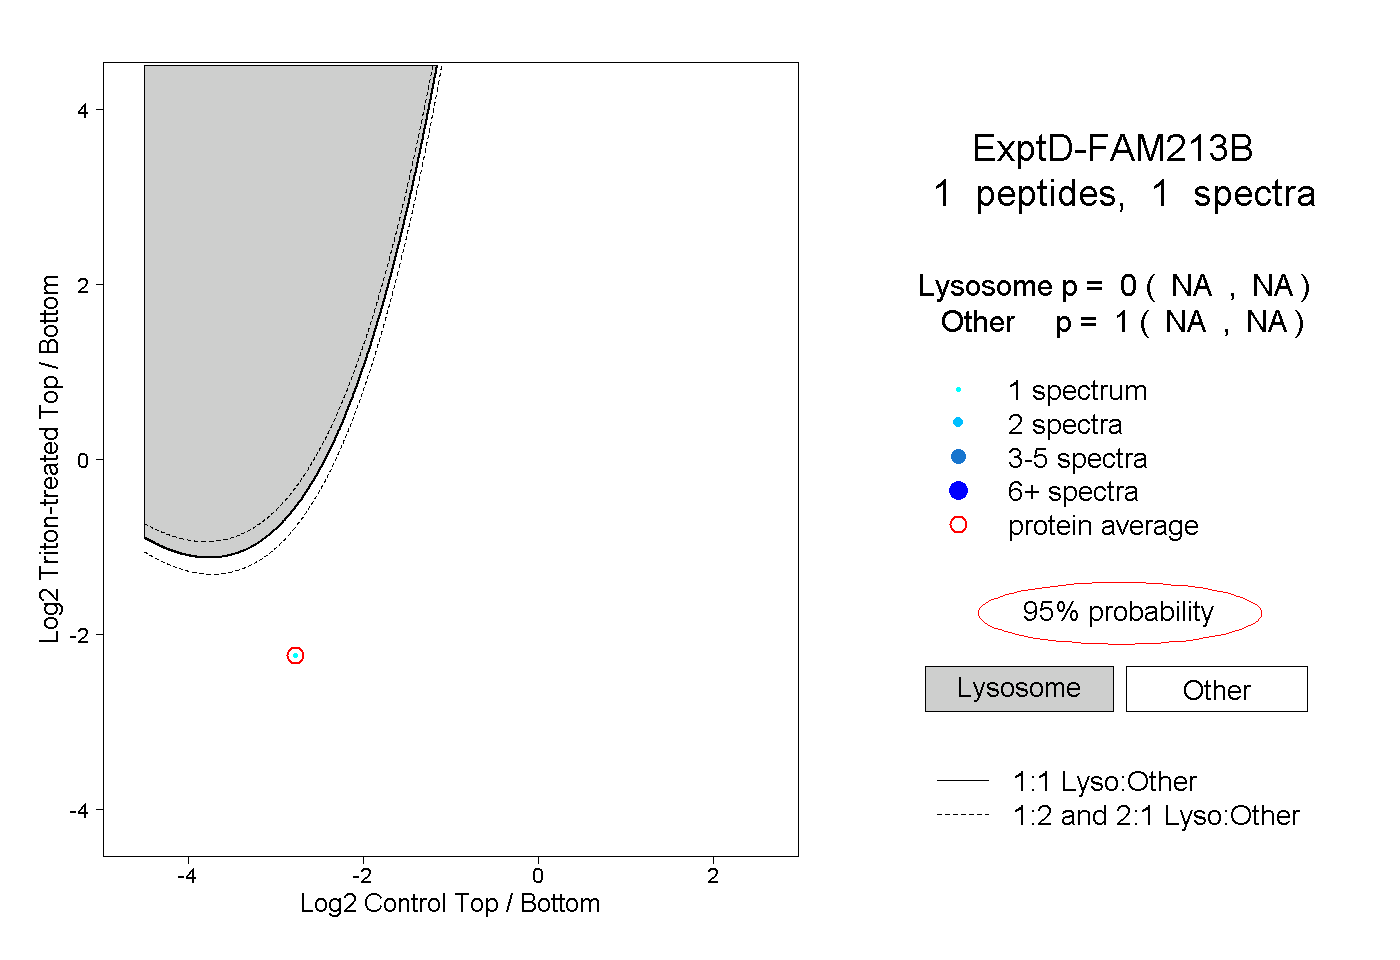
NA | NA
NA | NA