 4
4peptides
spectra
0.121 | 0.143
0.000 | 0.056
0.213 | 0.266
0.000 | 0.000
0.000 | 0.000
0.000 | 0.000
0.589 | 0.606
0.000 | 0.000
| Plot | Mito | Lyso | Perox | ER | Golgi | PM | Cytosol | Nucleus | |||||
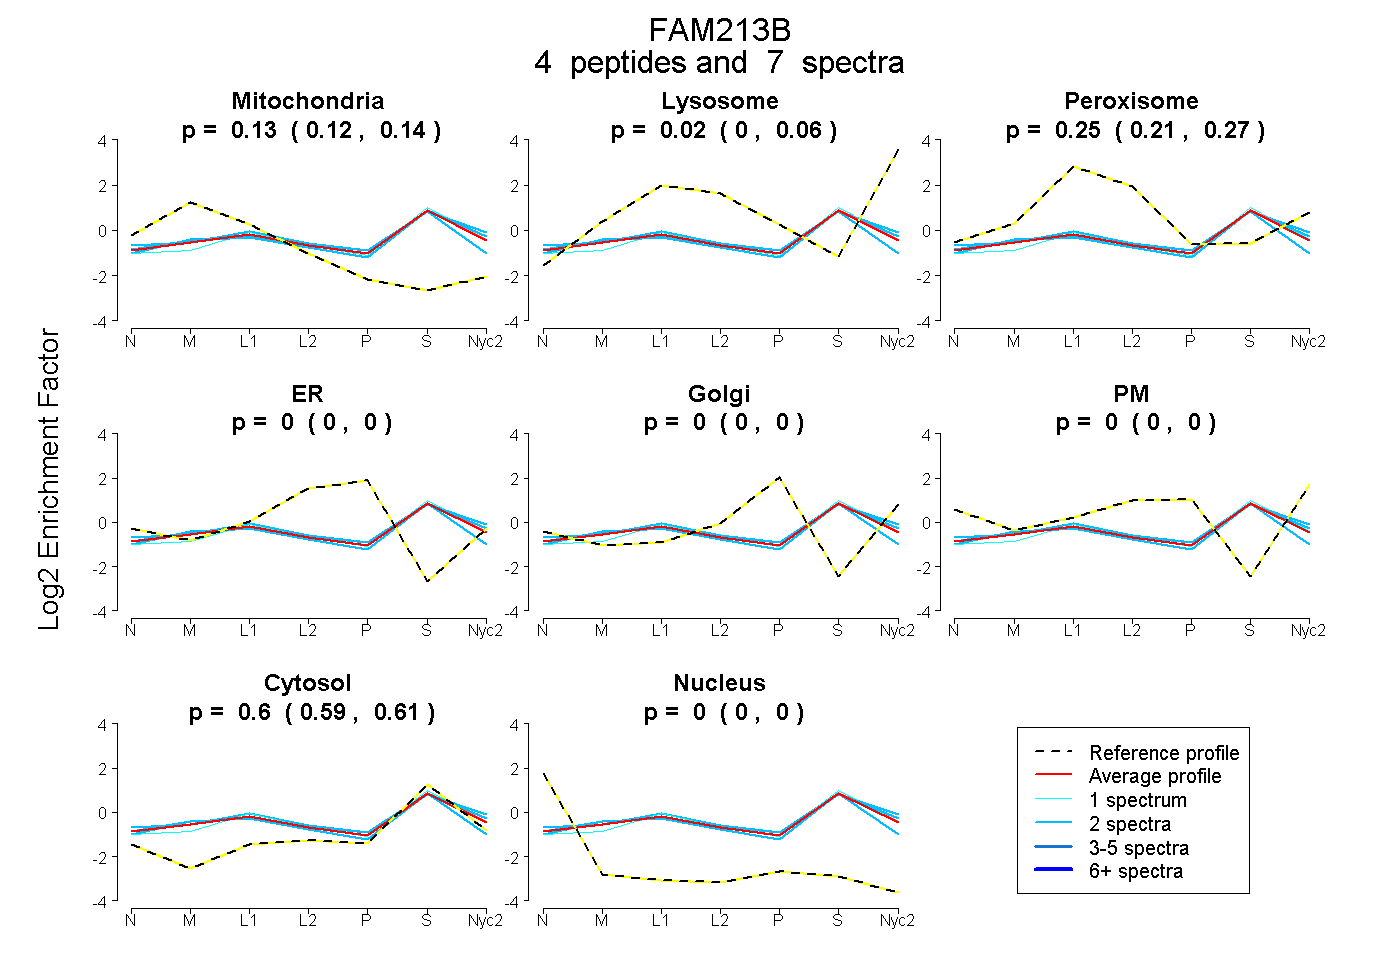
| Expt A |
4 peptides |
7 spectra |
|
0.132 0.121 | 0.143 |
0.024 0.000 | 0.056 |
0.245 0.213 | 0.266 |
0.000 0.000 | 0.000 |
0.000 0.000 | 0.000 |
0.000 0.000 | 0.000 |
0.598 0.589 | 0.606 |
0.000 0.000 | 0.000 |
| 2 spectra, WIAQDLSNLR | 0.161 | 0.085 | 0.159 | 0.000 | 0.000 | 0.000 | 0.594 | 0.000 | ||
| 1 spectrum, VGACVLK | 0.072 | 0.000 | 0.284 | 0.000 | 0.000 | 0.000 | 0.644 | 0.000 | ||
| 2 spectra, GILDQNDVR | 0.108 | 0.079 | 0.242 | 0.000 | 0.000 | 0.000 | 0.571 | 0.000 | ||
| 2 spectra, FGCMVCR | 0.185 | 0.000 | 0.220 | 0.000 | 0.000 | 0.000 | 0.594 | 0.000 |
| Plot | Mito | Lyso or Perox | ER | Golgi | PM | Cytosol | Nucleus | ||||||
| Expt B |
3 peptides |
6 spectra |
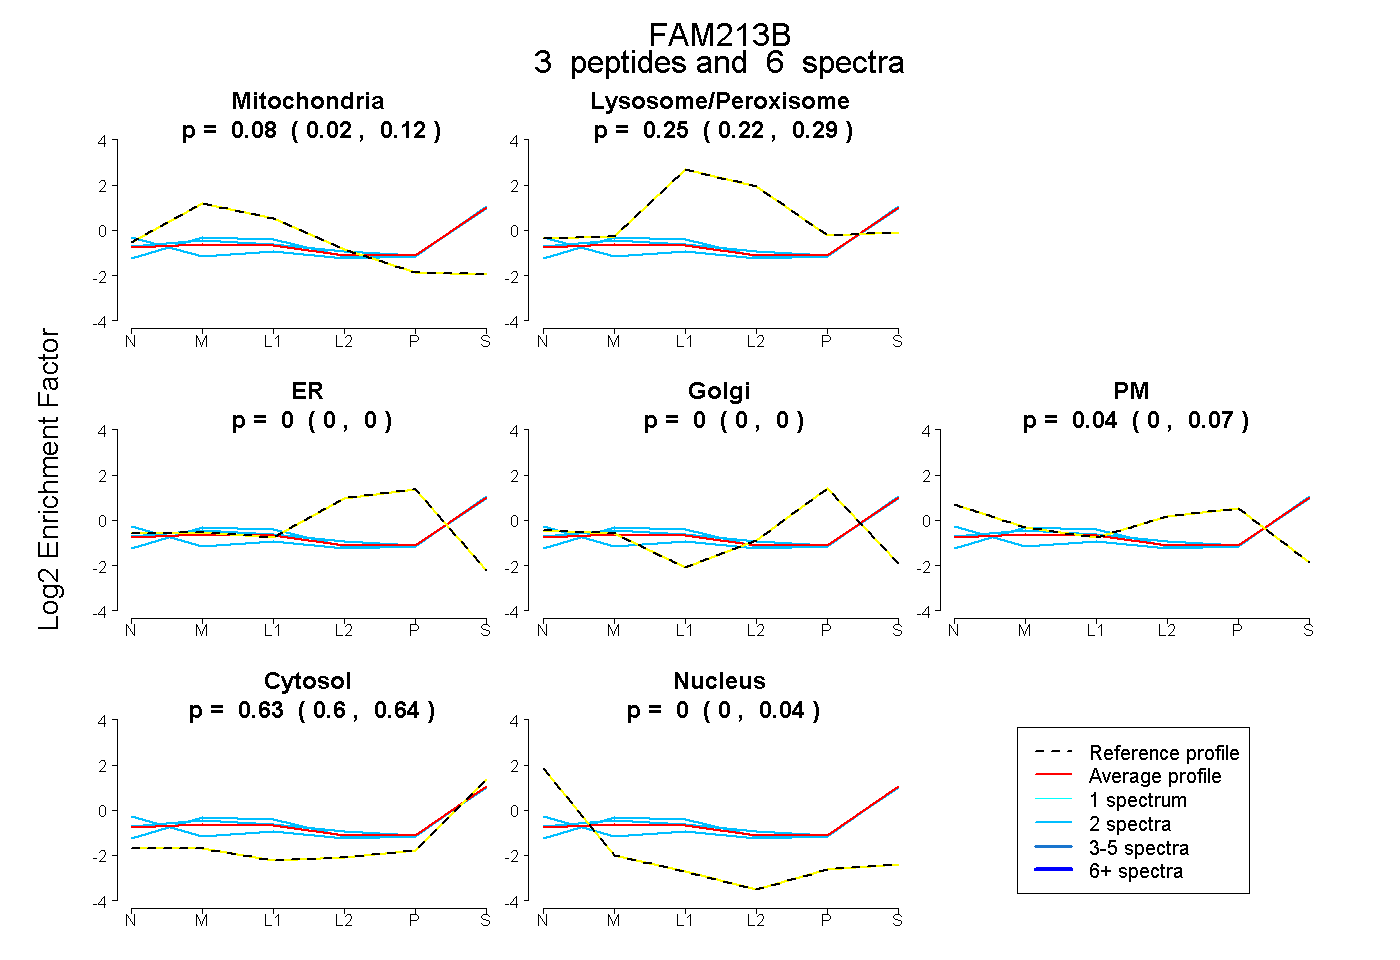 |
0.081 0.018 | 0.117 |
0.249 0.223 | 0.287 |
0.000 0.000 | 0.000 |
0.000 0.000 | 0.000 |
0.043 0.001 | 0.067 |
0.626 0.596 | 0.644 |
0.000 0.000 | 0.036 |
|||
| Plot | Lyso | Other | |||||||||||
| Expt C |
6 peptides |
17 spectra |
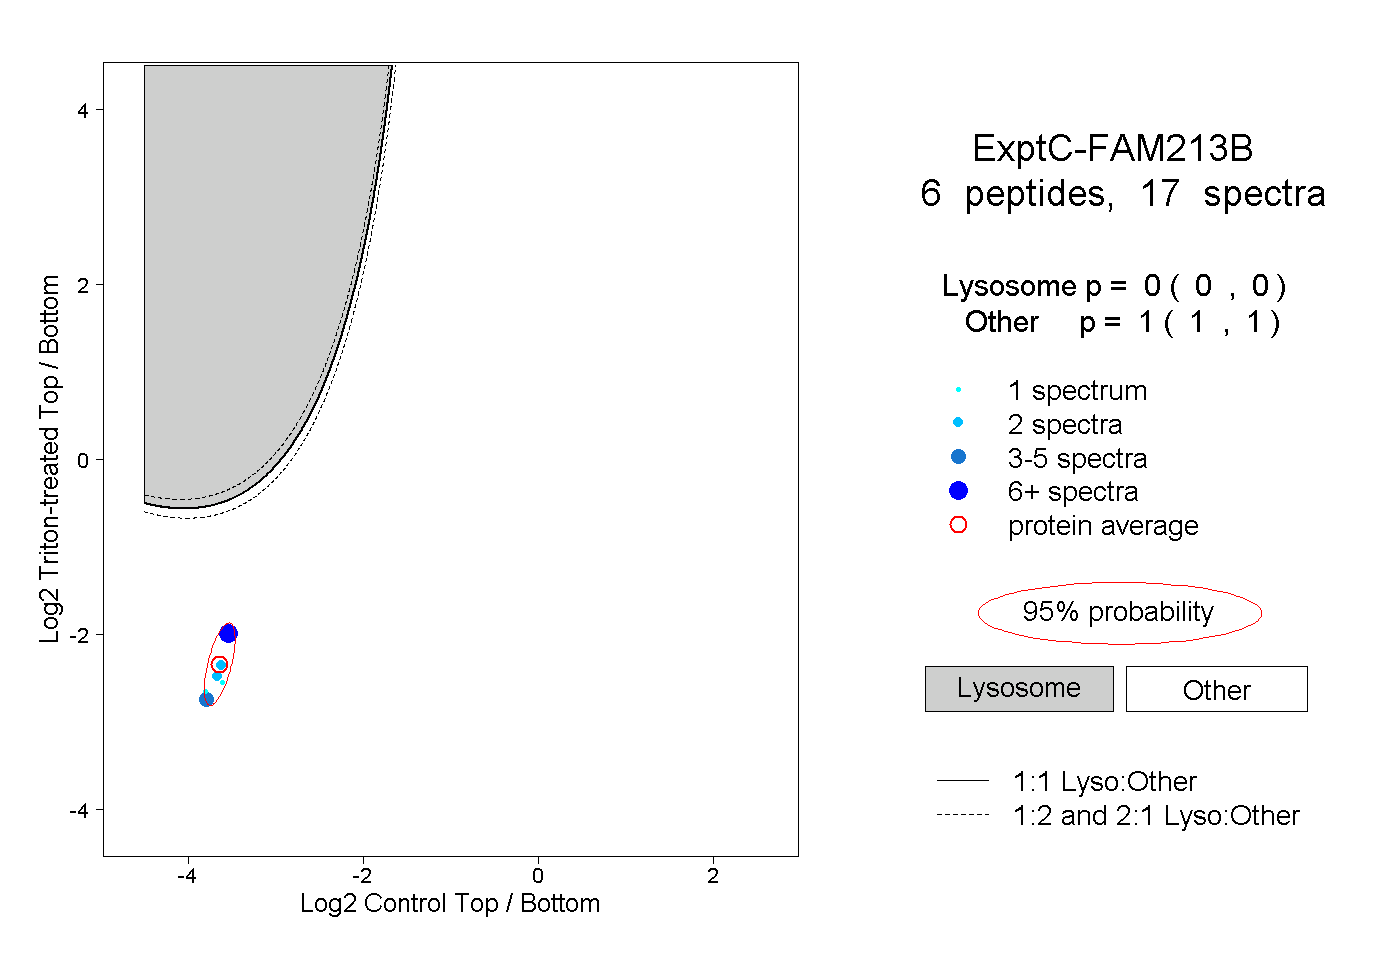 |
0.000 0.000 | 0.000 |
1.000 1.000 | 1.000 |
||||||||
| Plot | Lyso | Other | |||||||||||
| Expt D |
1 peptide |
1 spectrum |
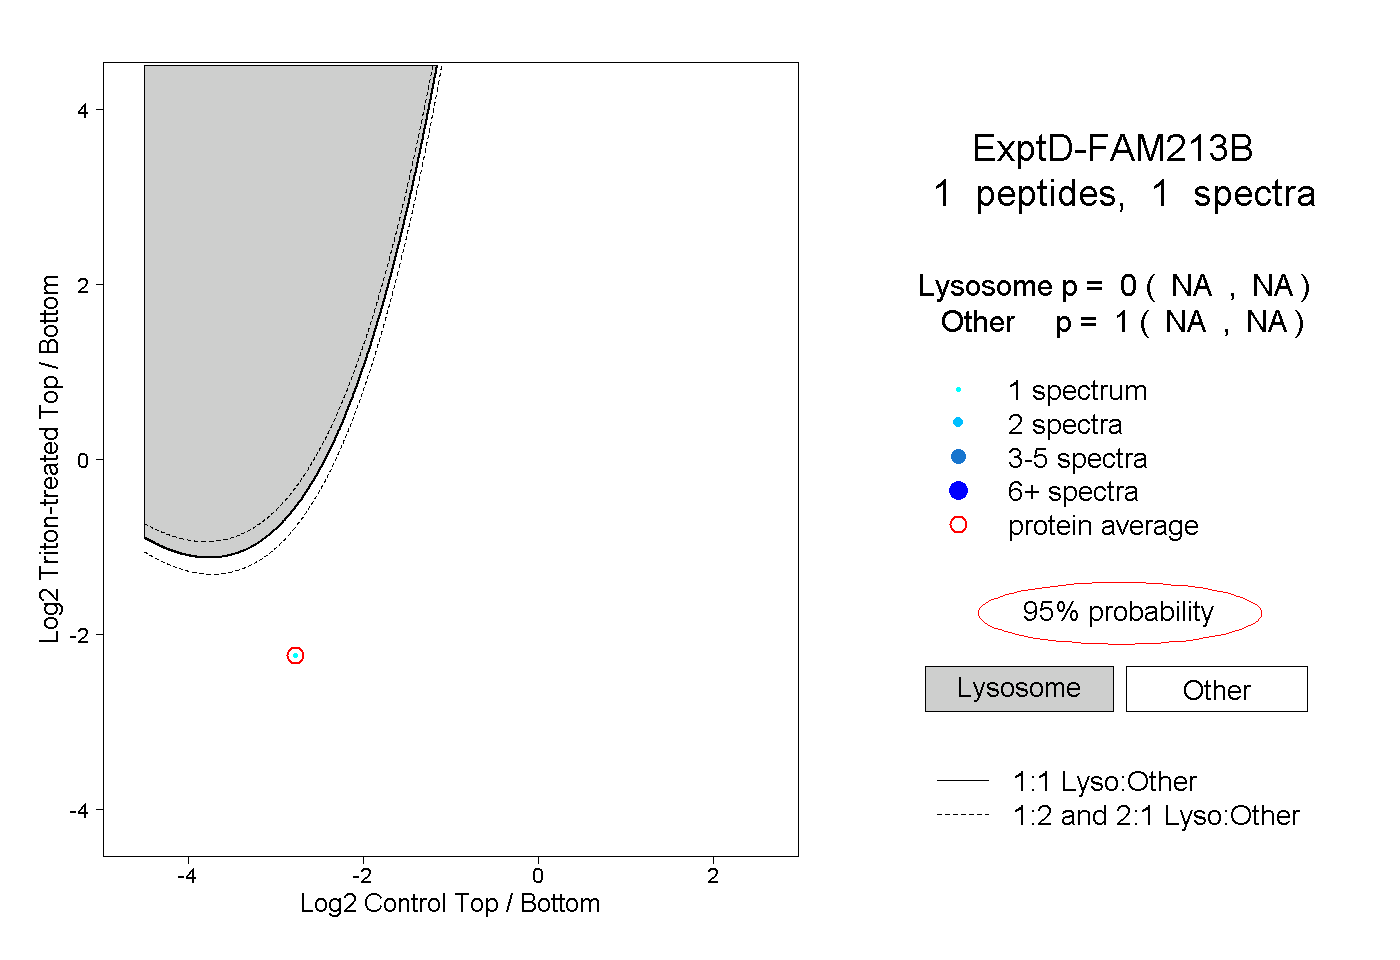 |
0.000 NA | NA |
1.000 NA | NA |