 4
4peptides
spectra
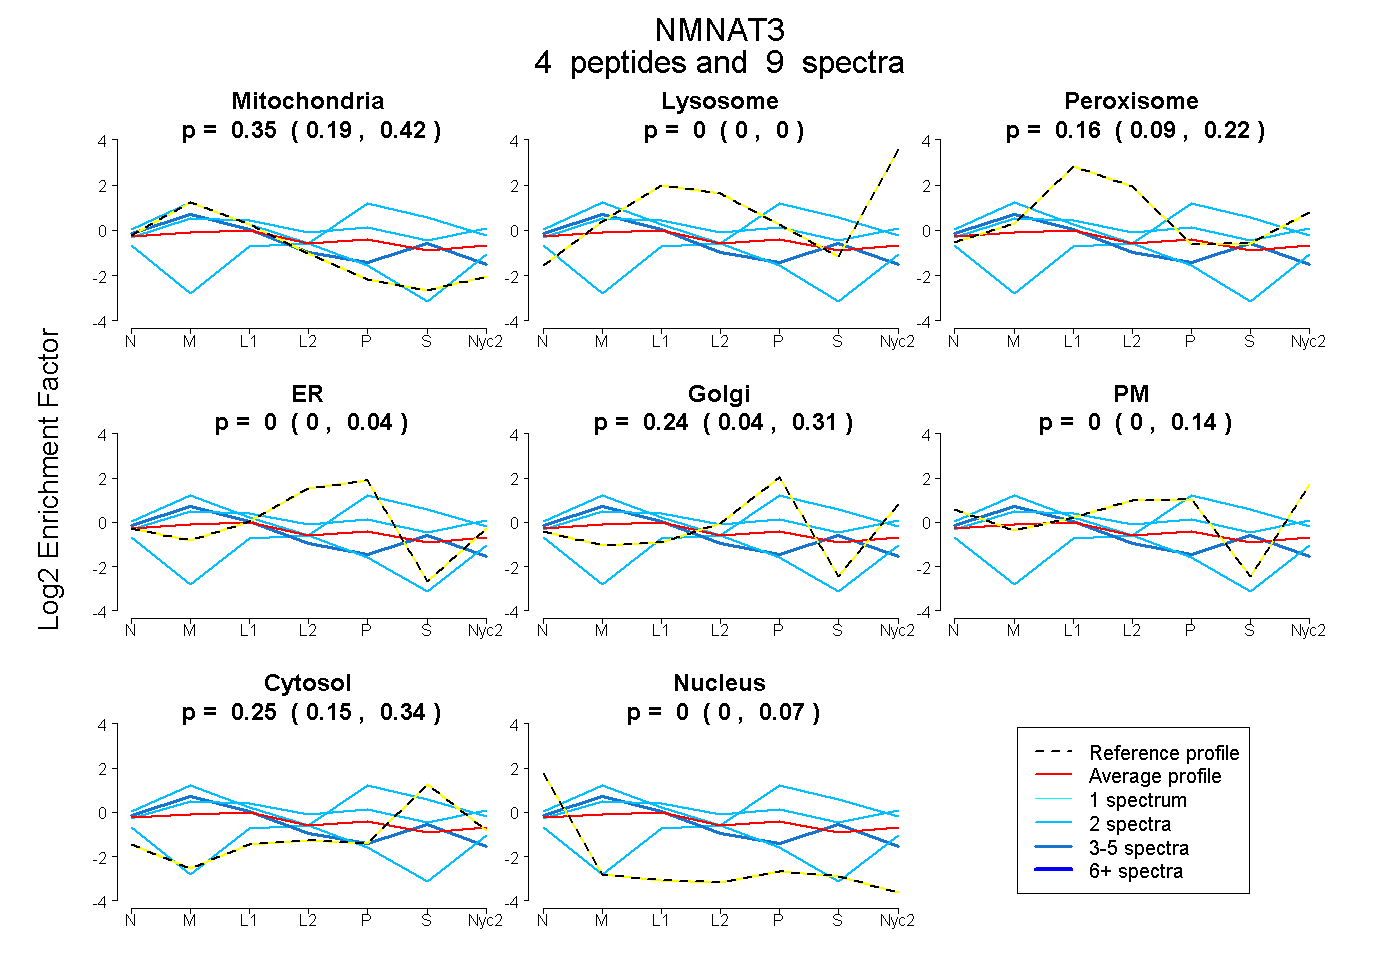
0.194 | 0.421
0.000 | 0.000
0.087 | 0.221
0.000 | 0.037
0.041 | 0.312
0.000 | 0.145
0.146 | 0.337
0.000 | 0.069
1peptide
spectra
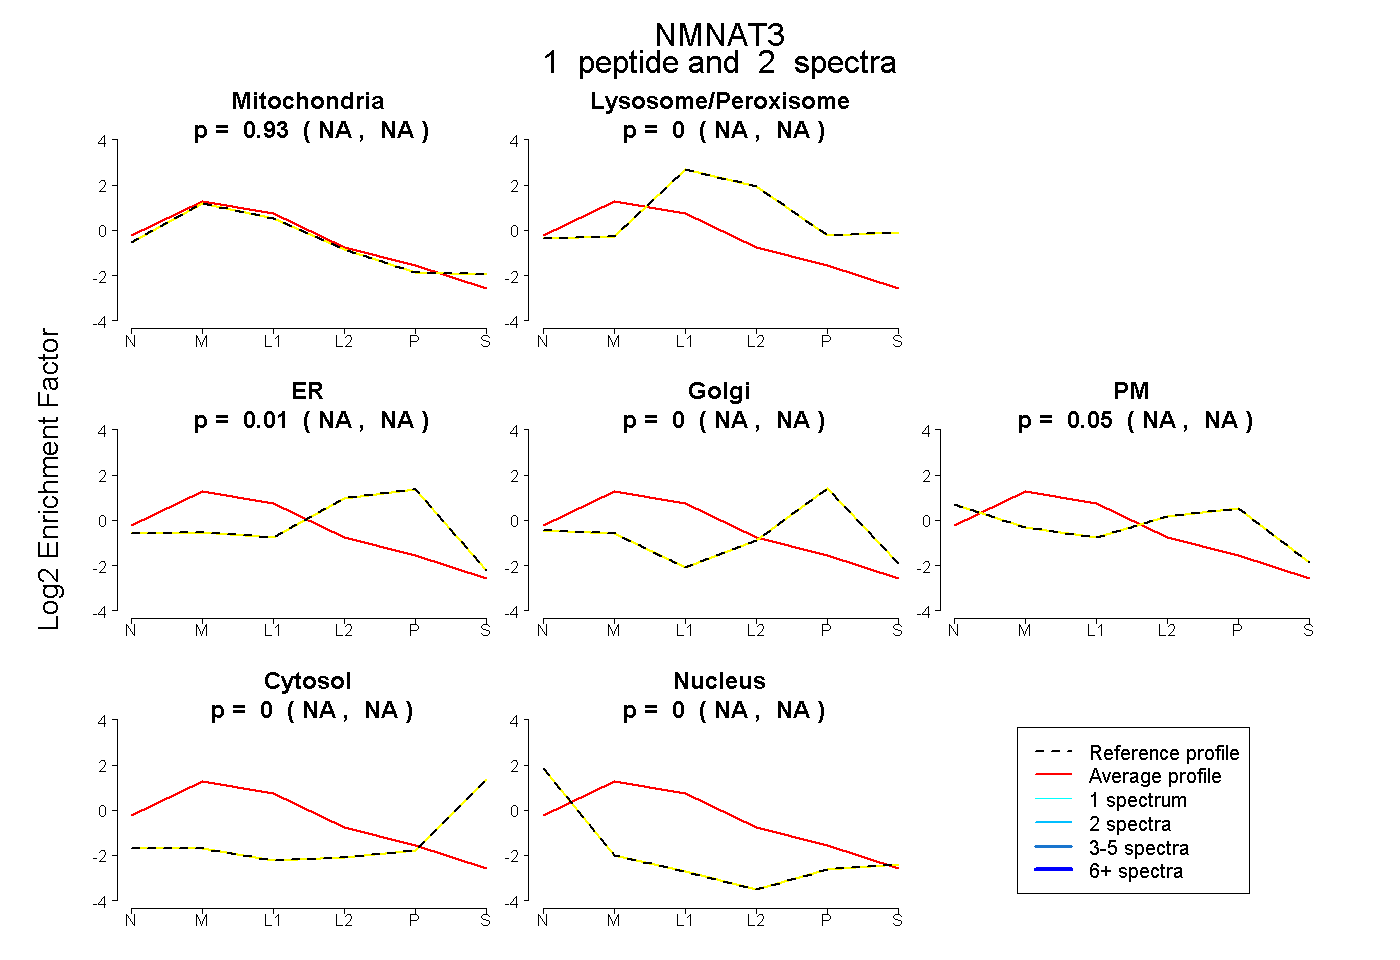
NA | NA
NA | NA
NA | NA
NA | NA
NA | NA
NA | NA
NA | NA
3peptides
spectra
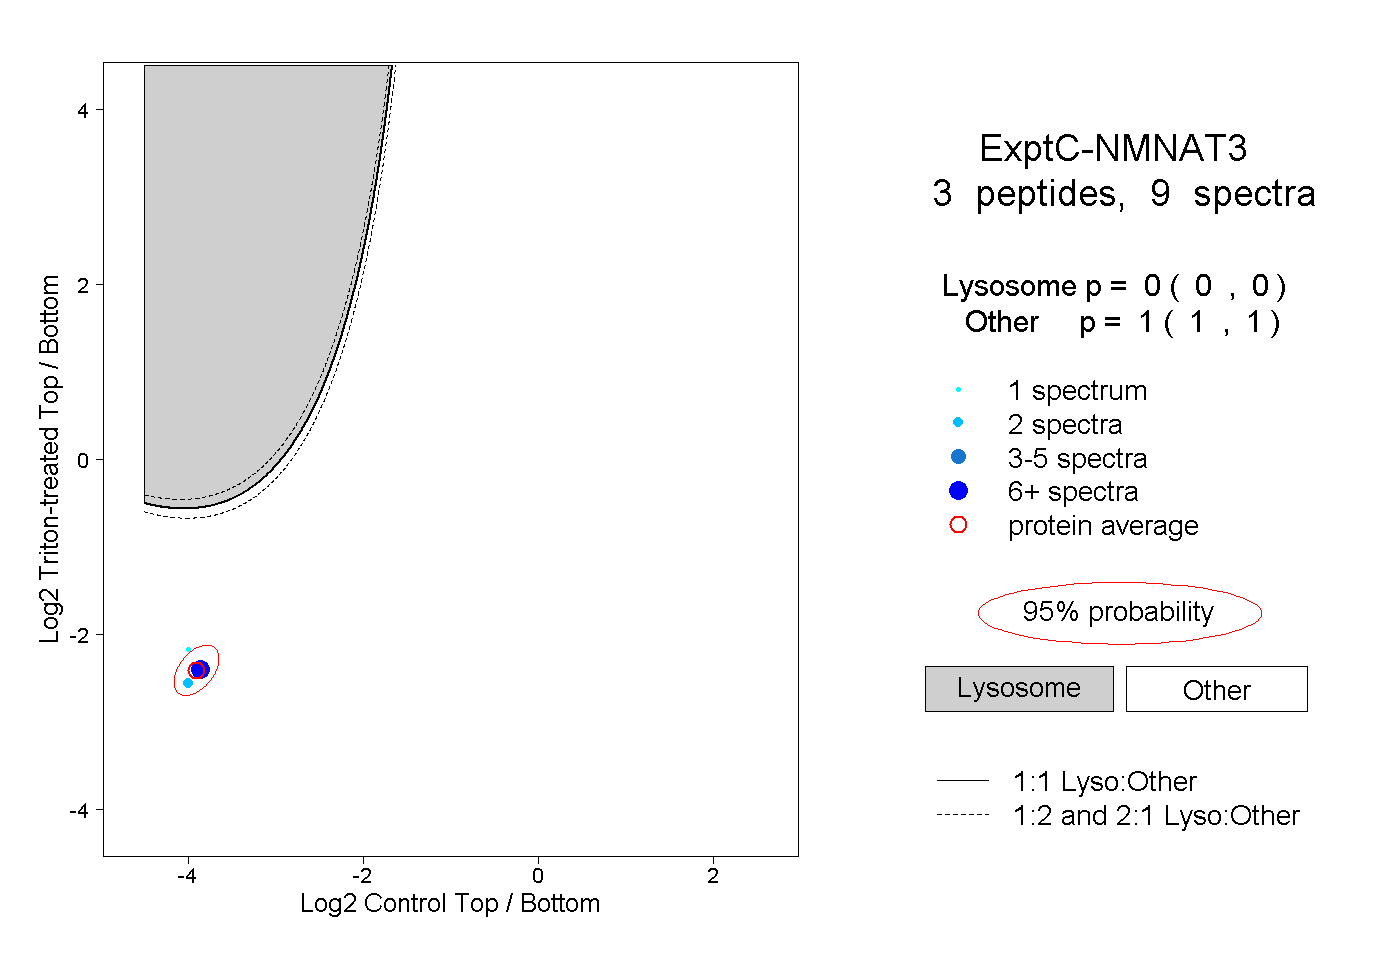
0.000 | 0.000
1.000 | 1.000
1peptide
spectra
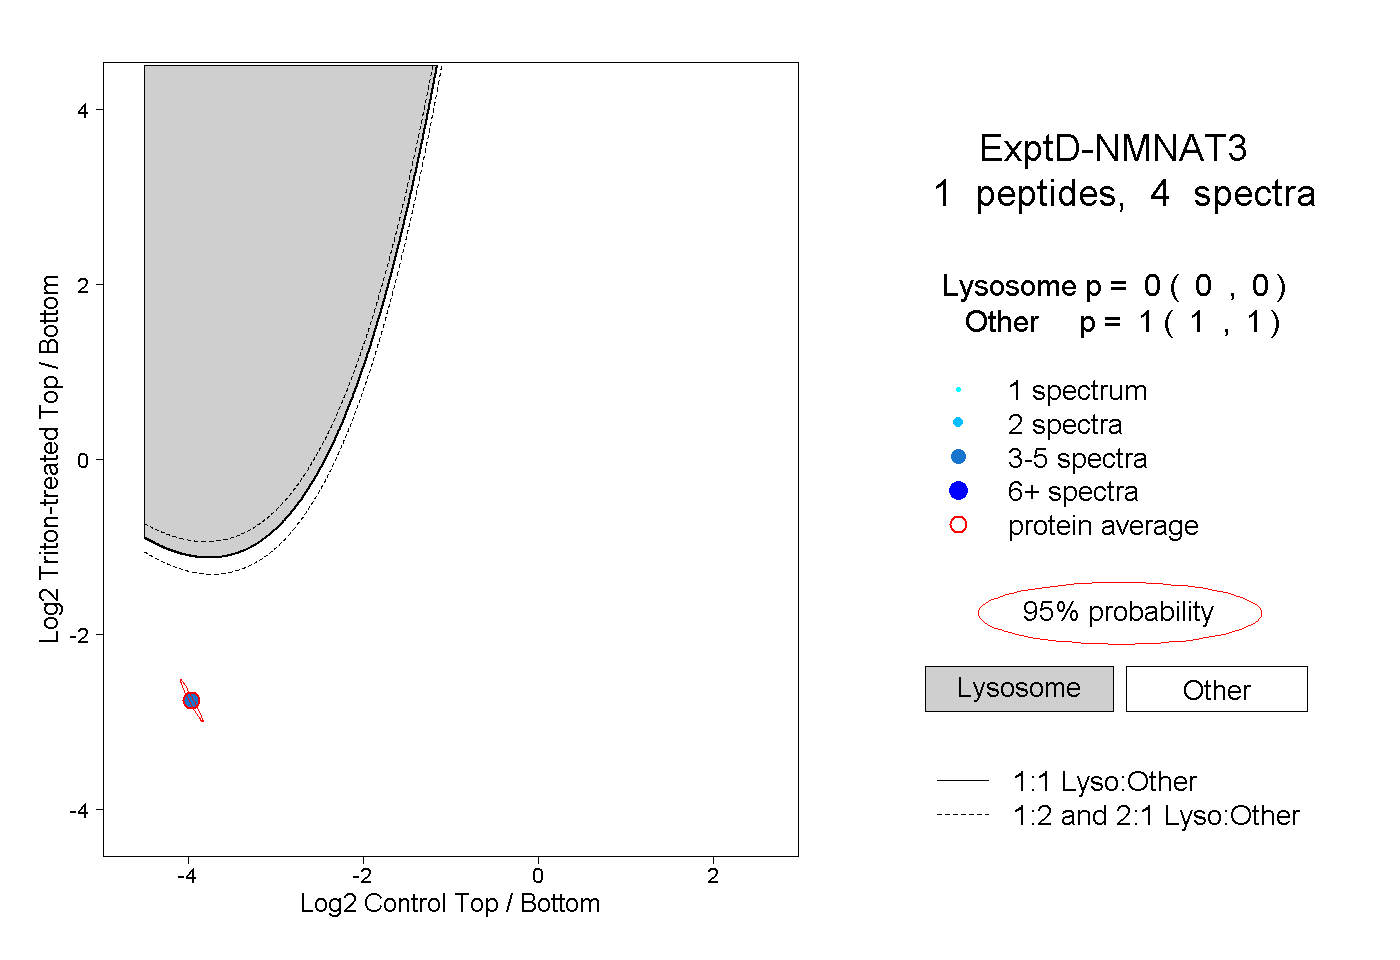
0.000 | 0.000
1.000 | 1.000