 5
5peptides
spectra
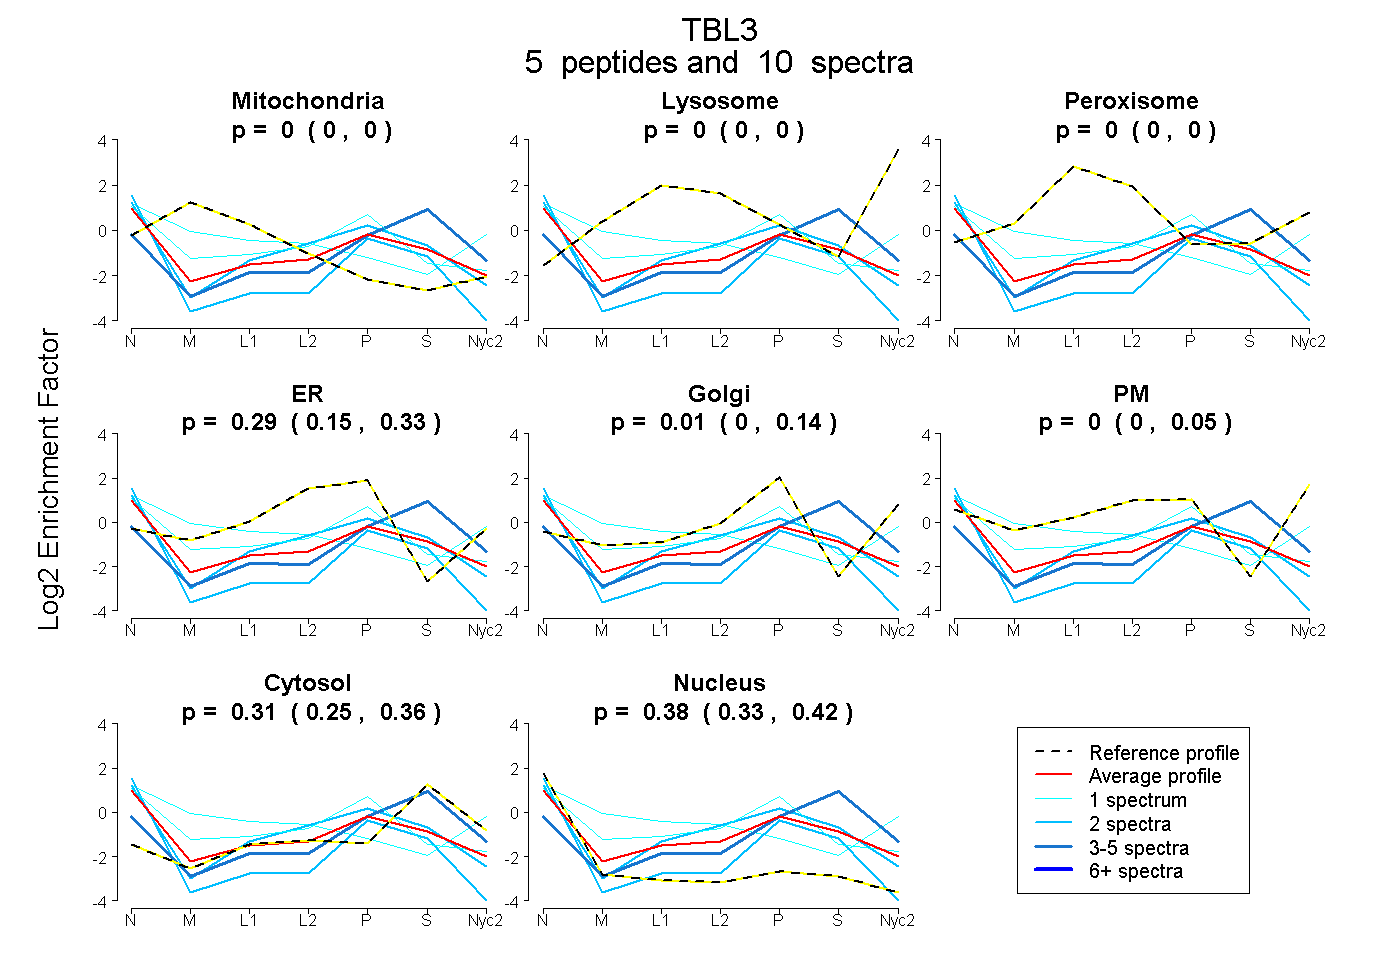
0.000 | 0.000
0.000 | 0.000
0.000 | 0.000
0.145 | 0.331
0.000 | 0.137
0.000 | 0.046
0.250 | 0.360
0.333 | 0.417
| Plot | Mito | Lyso | Perox | ER | Golgi | PM | Cytosol | Nucleus | |||||
| Expt A |
5 peptides |
10 spectra |
|
0.000 0.000 | 0.000 |
0.000 0.000 | 0.000 |
0.000 0.000 | 0.000 |
0.294 0.145 | 0.331 |
0.012 0.000 | 0.137 |
0.000 0.000 | 0.046 |
0.312 0.250 | 0.360 |
0.382 0.333 | 0.417 |
| 2 spectra, HEAPEELLAYDGVR | 0.000 | 0.000 | 0.000 | 0.347 | 0.000 | 0.000 | 0.292 | 0.361 | ||
| 1 spectrum, VWSLQDR | 0.000 | 0.000 | 0.003 | 0.485 | 0.069 | 0.000 | 0.119 | 0.324 | ||
| 2 spectra, QQELDNLLHEK | 0.000 | 0.000 | 0.000 | 0.049 | 0.000 | 0.000 | 0.207 | 0.744 | ||
| 4 spectra, VAFVSR | 0.000 | 0.000 | 0.000 | 0.000 | 0.098 | 0.000 | 0.749 | 0.153 | ||
| 1 spectrum, GALEALLPYTER | 0.246 | 0.036 | 0.097 | 0.000 | 0.000 | 0.374 | 0.000 | 0.247 |
| Plot | Lyso | Other | |||||||||||
| Expt D |
1 peptide |
2 spectra |
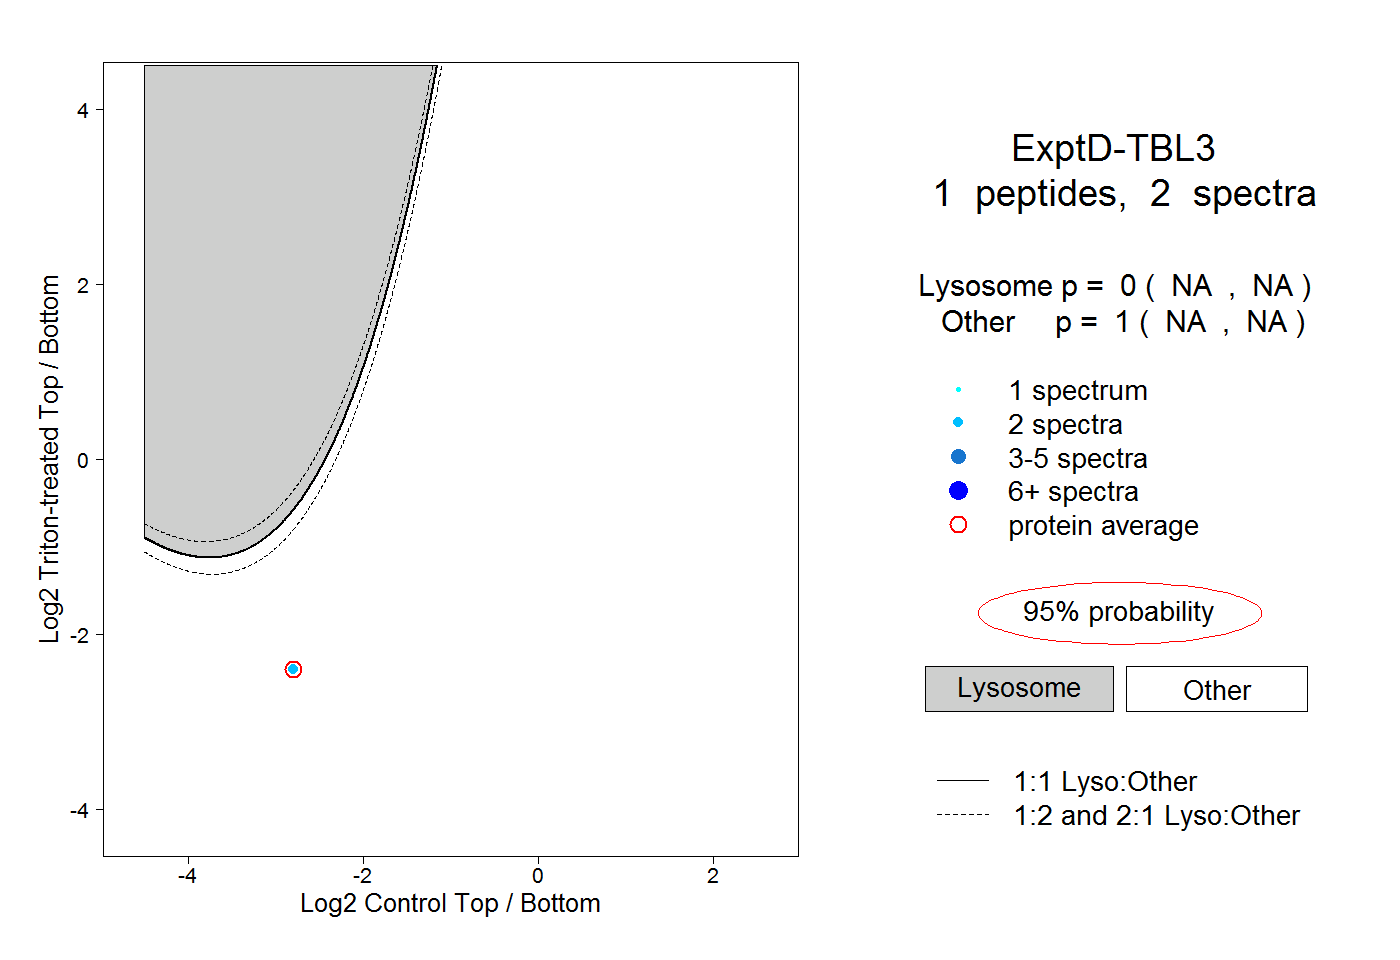 |
0.000 NA | NA |
1.000 NA | NA |