 4
4peptides
spectra
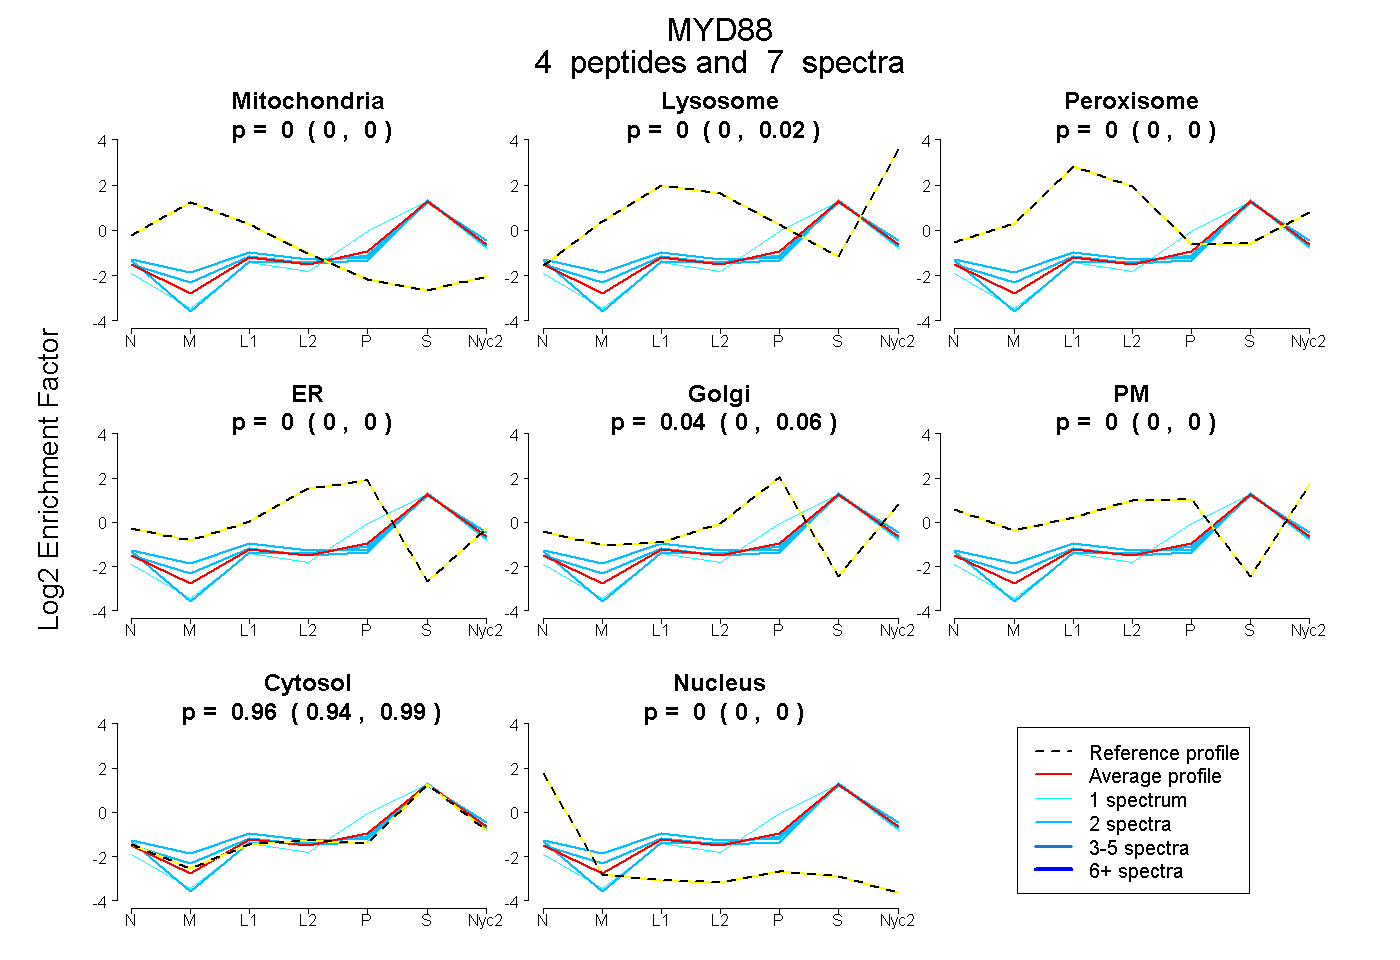
0.000 | 0.000
0.000 | 0.016
0.000 | 0.000
0.000 | 0.000
0.005 | 0.058
0.000 | 0.000
0.935 | 0.985
0.000 | 0.000
1peptide
spectrum
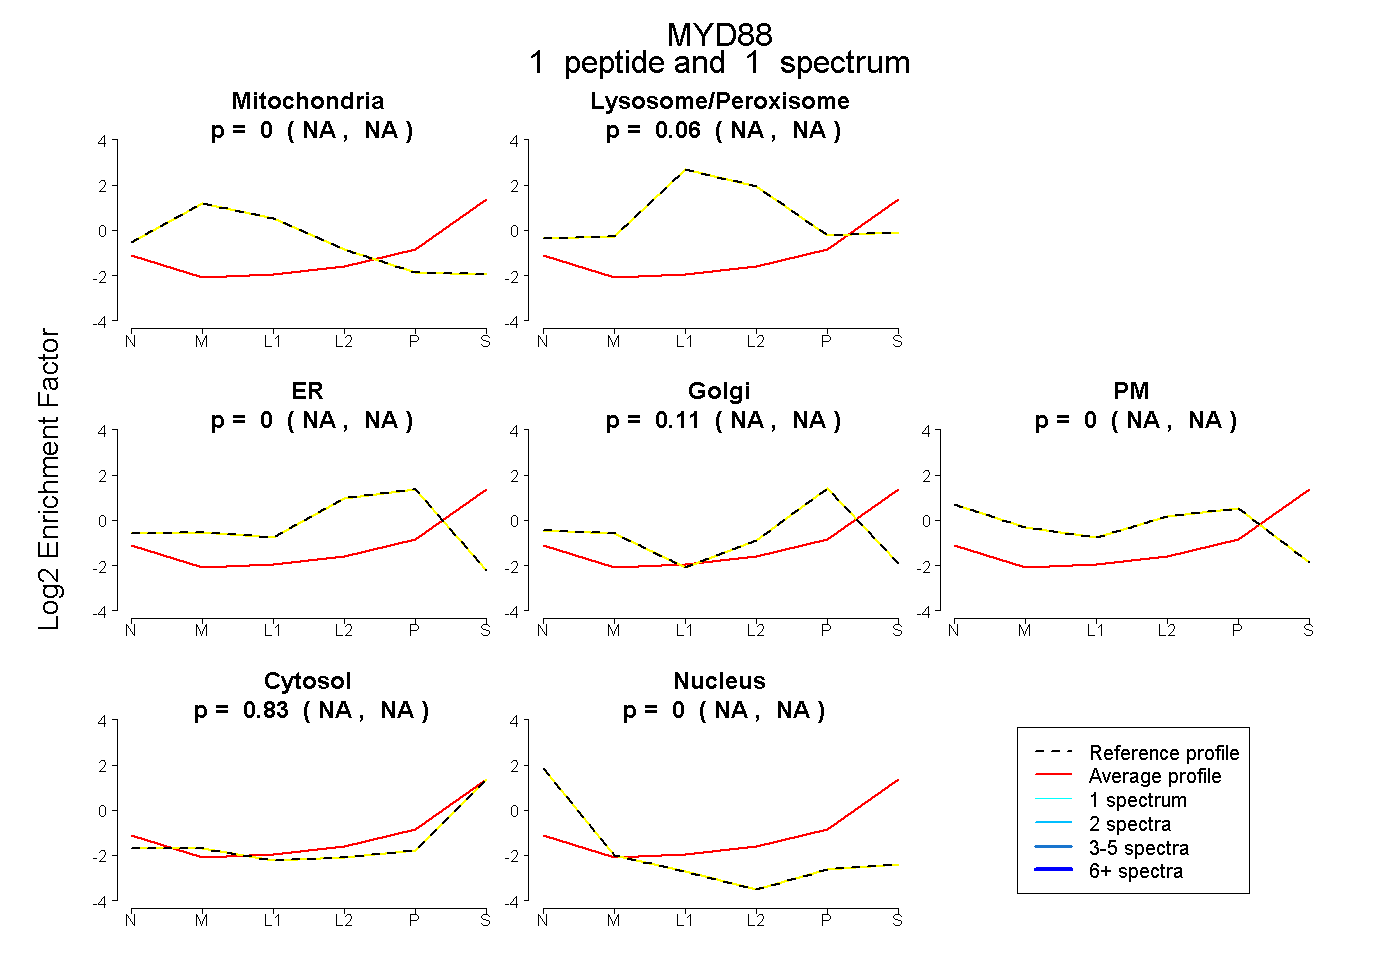
NA | NA
NA | NA
NA | NA
NA | NA
NA | NA
NA | NA
NA | NA
4peptides
spectra
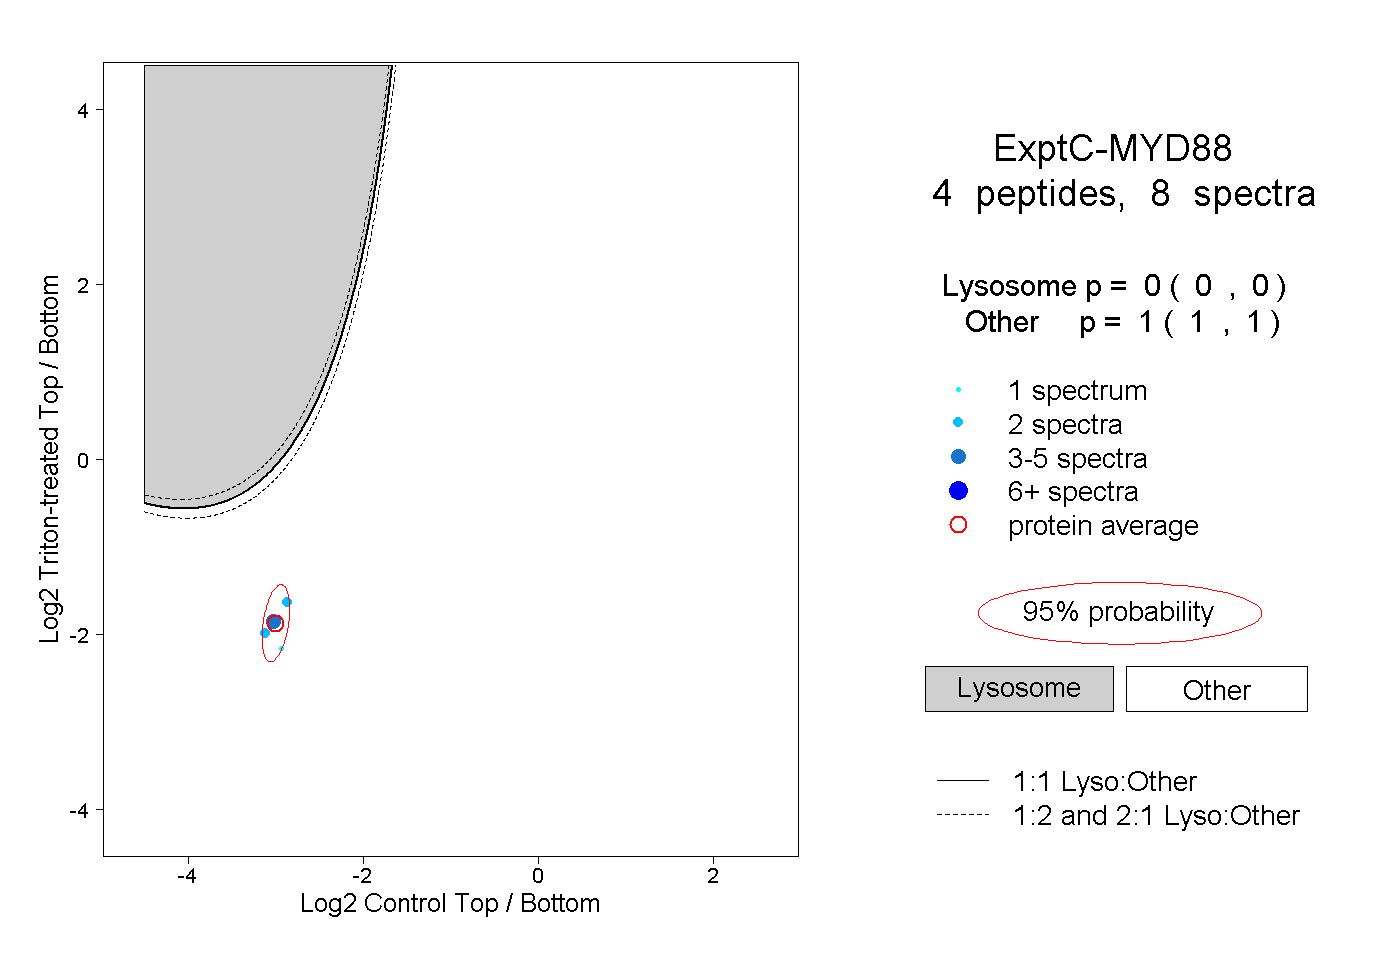
0.000 | 0.000
1.000 | 1.000