14
14peptides
spectra
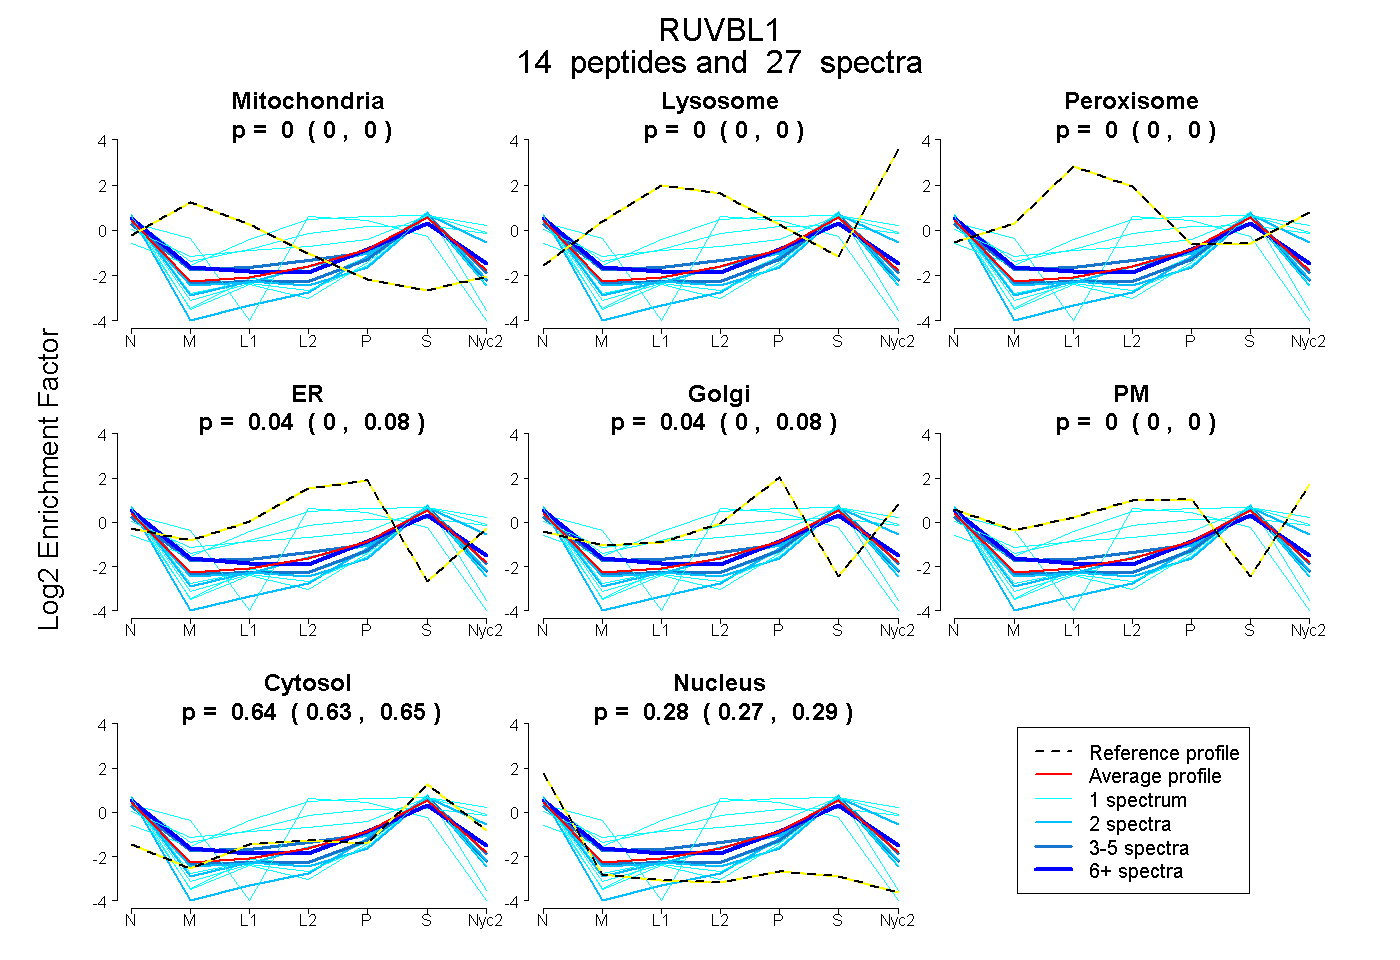
0.000 | 0.000
0.000 | 0.000
0.000 | 0.000
0.000 | 0.077
0.000 | 0.080
0.000 | 0.003
0.632 | 0.649
0.266 | 0.286
4peptides
spectra
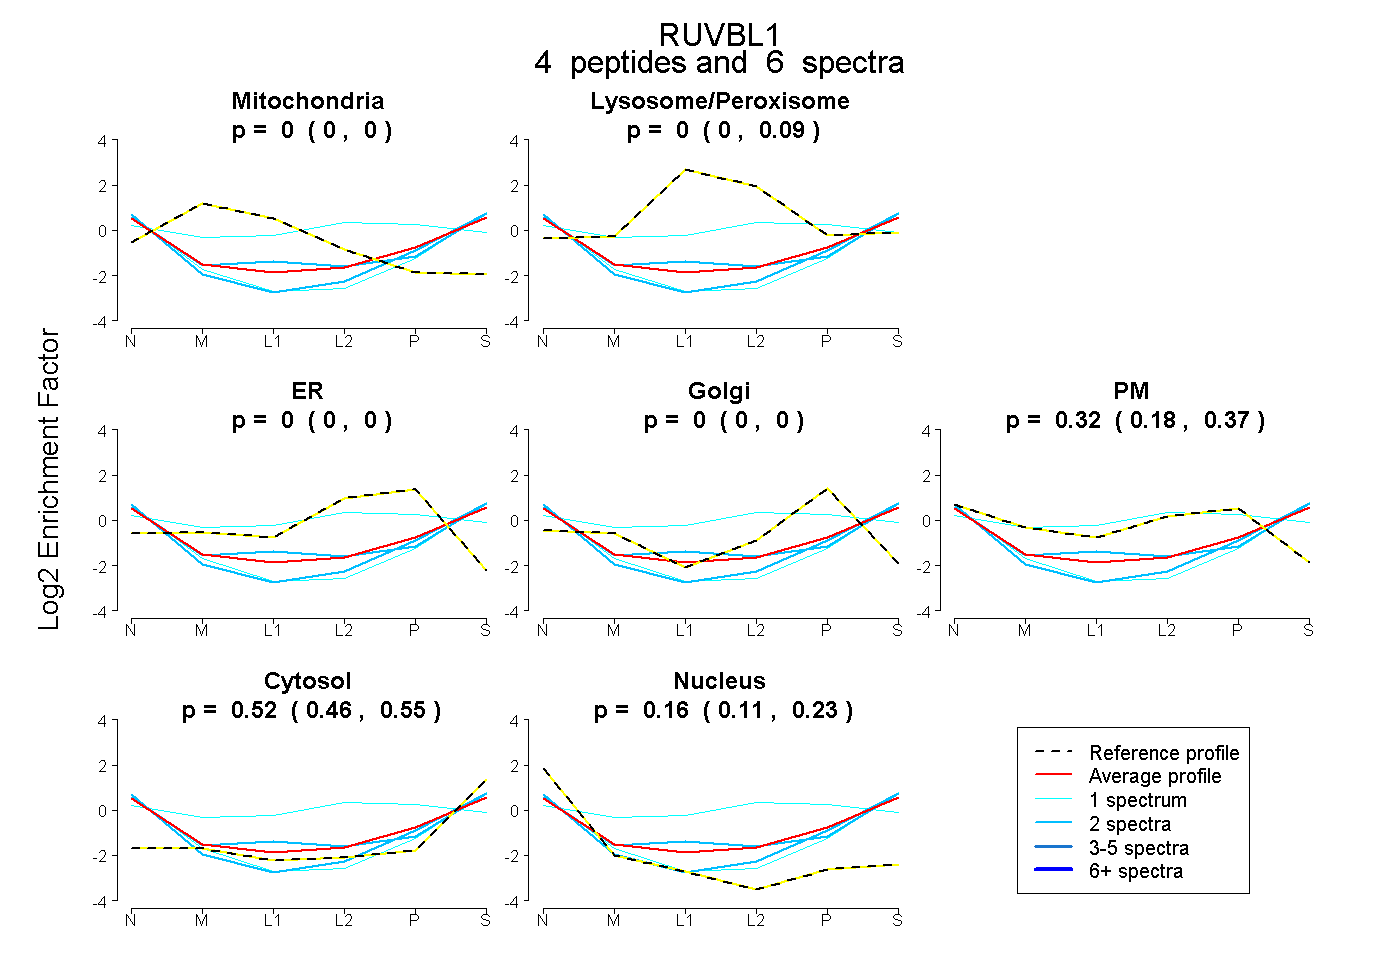
0.000 | 0.000
0.000 | 0.093
0.000 | 0.000
0.000 | 0.000
0.183 | 0.367
0.464 | 0.545
0.109 | 0.228