 14
14peptides
spectra
0.000 | 0.000
0.000 | 0.000
0.000 | 0.000
0.000 | 0.077
0.000 | 0.080
0.000 | 0.003
0.632 | 0.649
0.266 | 0.286
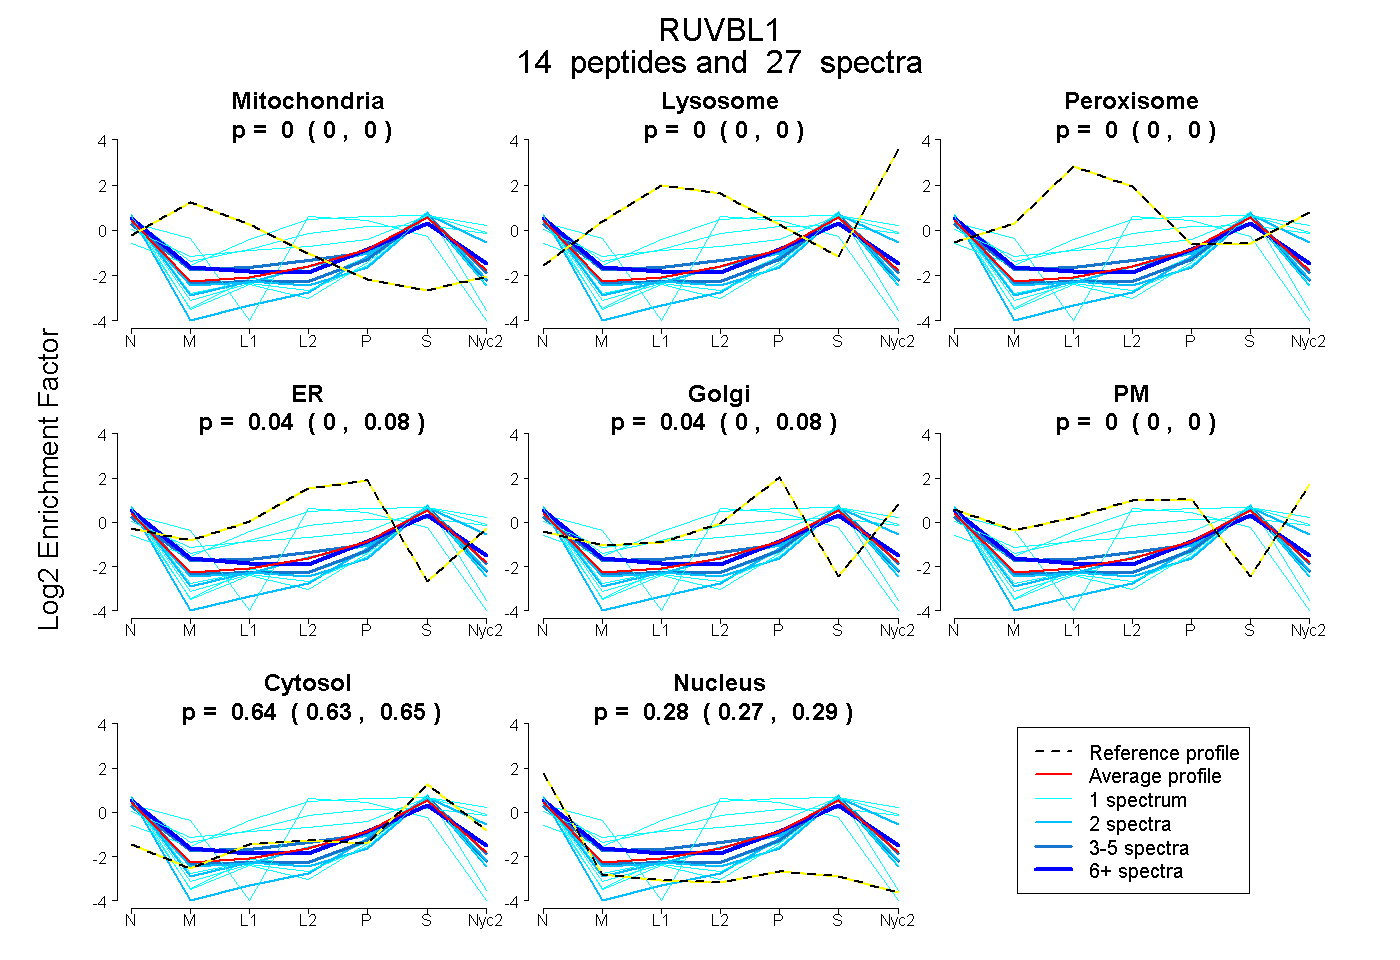
| Plot | Mito | Lyso | Perox | ER | Golgi | PM | Cytosol | Nucleus | |||||
| Expt A |
14 peptides |
27 spectra |
|
0.000 0.000 | 0.000 |
0.000 0.000 | 0.000 |
0.000 0.000 | 0.000 |
0.039 0.000 | 0.077 |
0.043 0.000 | 0.080 |
0.000 0.000 | 0.003 |
0.641 0.632 | 0.649 |
0.277 0.266 | 0.286 |
| 3 spectra, EACGVIVELIK | 0.051 | 0.000 | 0.012 | 0.070 | 0.000 | 0.000 | 0.625 | 0.242 | ||
| 1 spectrum, YSVQLLTPANLLAK | 0.000 | 0.000 | 0.000 | 0.000 | 0.000 | 0.000 | 0.589 | 0.411 | ||
| 1 spectrum, TALALAIAQELGSK | 0.000 | 0.000 | 0.000 | 0.034 | 0.000 | 0.420 | 0.513 | 0.033 | ||
| 1 spectrum, IEEVK | 0.000 | 0.153 | 0.042 | 0.288 | 0.000 | 0.006 | 0.512 | 0.000 | ||
| 1 spectrum, AVLLAGPPGTGK | 0.000 | 0.000 | 0.000 | 0.000 | 0.000 | 0.000 | 0.620 | 0.380 | ||
| 2 spectra, LDPSIFESLQK | 0.000 | 0.000 | 0.000 | 0.000 | 0.000 | 0.000 | 0.596 | 0.404 | ||
| 2 spectra, TEVLMENFR | 0.000 | 0.000 | 0.000 | 0.000 | 0.000 | 0.114 | 0.685 | 0.201 | ||
| 2 spectra, GLGLDESGLAK | 0.000 | 0.000 | 0.000 | 0.000 | 0.000 | 0.000 | 0.570 | 0.430 | ||
| 1 spectrum, TMLYTPQEMK | 0.027 | 0.000 | 0.030 | 0.000 | 0.000 | 0.305 | 0.638 | 0.000 | ||
| 1 spectrum, ALESSIAPIVIFASNR | 0.000 | 0.000 | 0.000 | 0.000 | 0.000 | 0.000 | 0.568 | 0.432 | ||
| 4 spectra, ILADQQDK | 0.000 | 0.000 | 0.000 | 0.000 | 0.000 | 0.000 | 0.659 | 0.341 | ||
| 1 spectrum, QAASGLVGQENAR | 0.000 | 0.000 | 0.000 | 0.372 | 0.000 | 0.000 | 0.248 | 0.380 | ||
| 1 spectrum, EHVEEISELFYDAK | 0.000 | 0.000 | 0.000 | 0.000 | 0.000 | 0.000 | 0.569 | 0.431 | ||
| 6 spectra, TISHVIIGLK | 0.003 | 0.000 | 0.000 | 0.000 | 0.022 | 0.119 | 0.574 | 0.284 |
| Plot | Mito | Lyso or Perox | ER | Golgi | PM | Cytosol | Nucleus | ||||||
| Expt B |
4 peptides |
6 spectra |
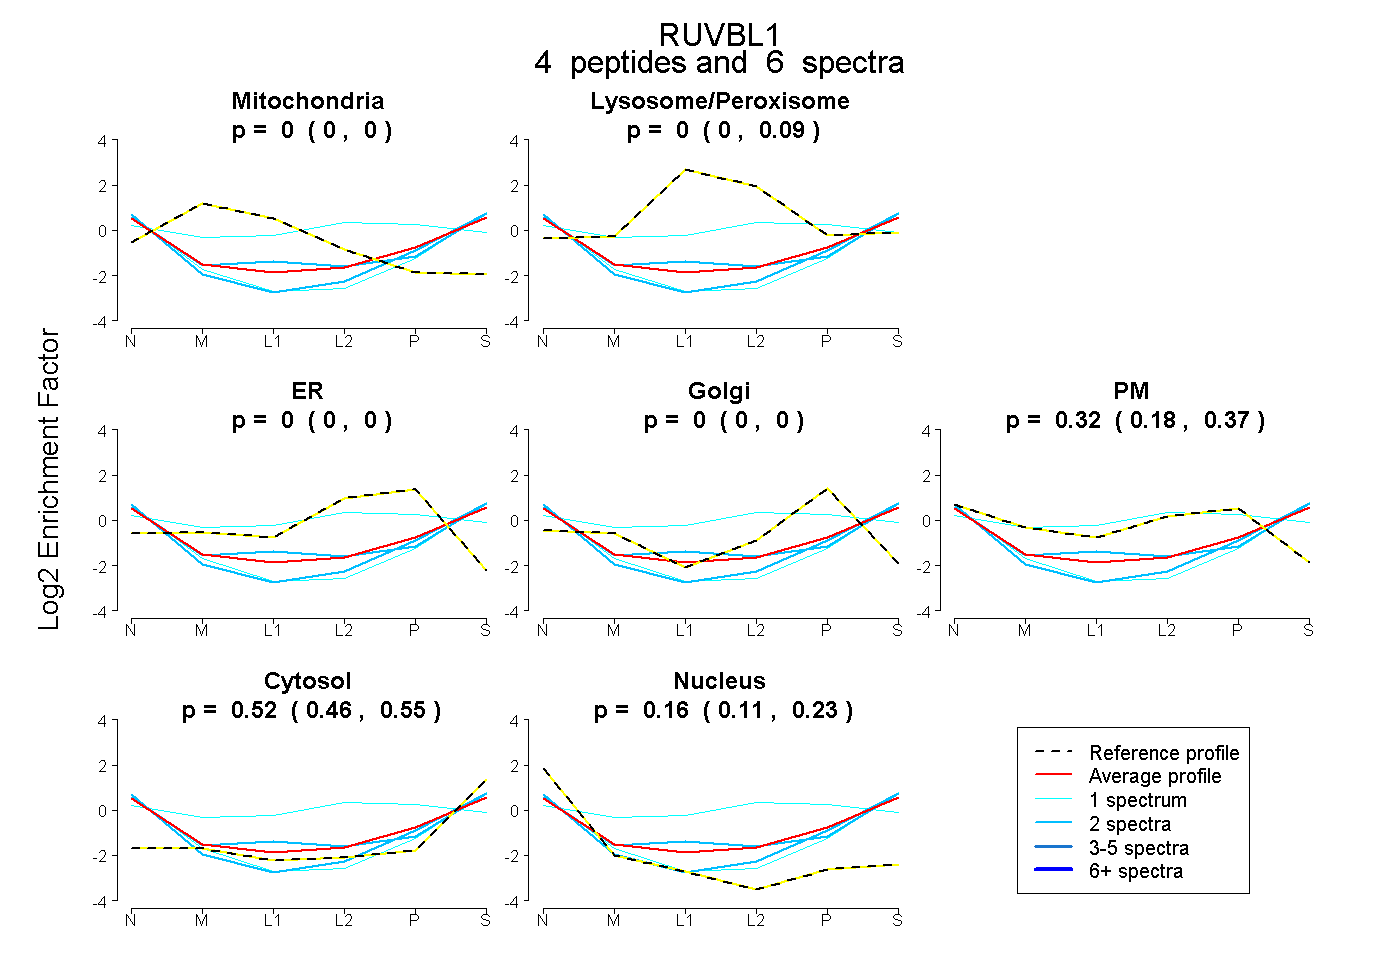 |
0.000 0.000 | 0.000 |
0.002 0.000 | 0.093 |
0.000 0.000 | 0.000 |
0.000 0.000 | 0.000 |
0.317 0.183 | 0.367 |
0.522 0.464 | 0.545 |
0.160 0.109 | 0.228 |
|||
| Plot | Lyso | Other | |||||||||||
| Expt C |
5 peptides |
7 spectra |
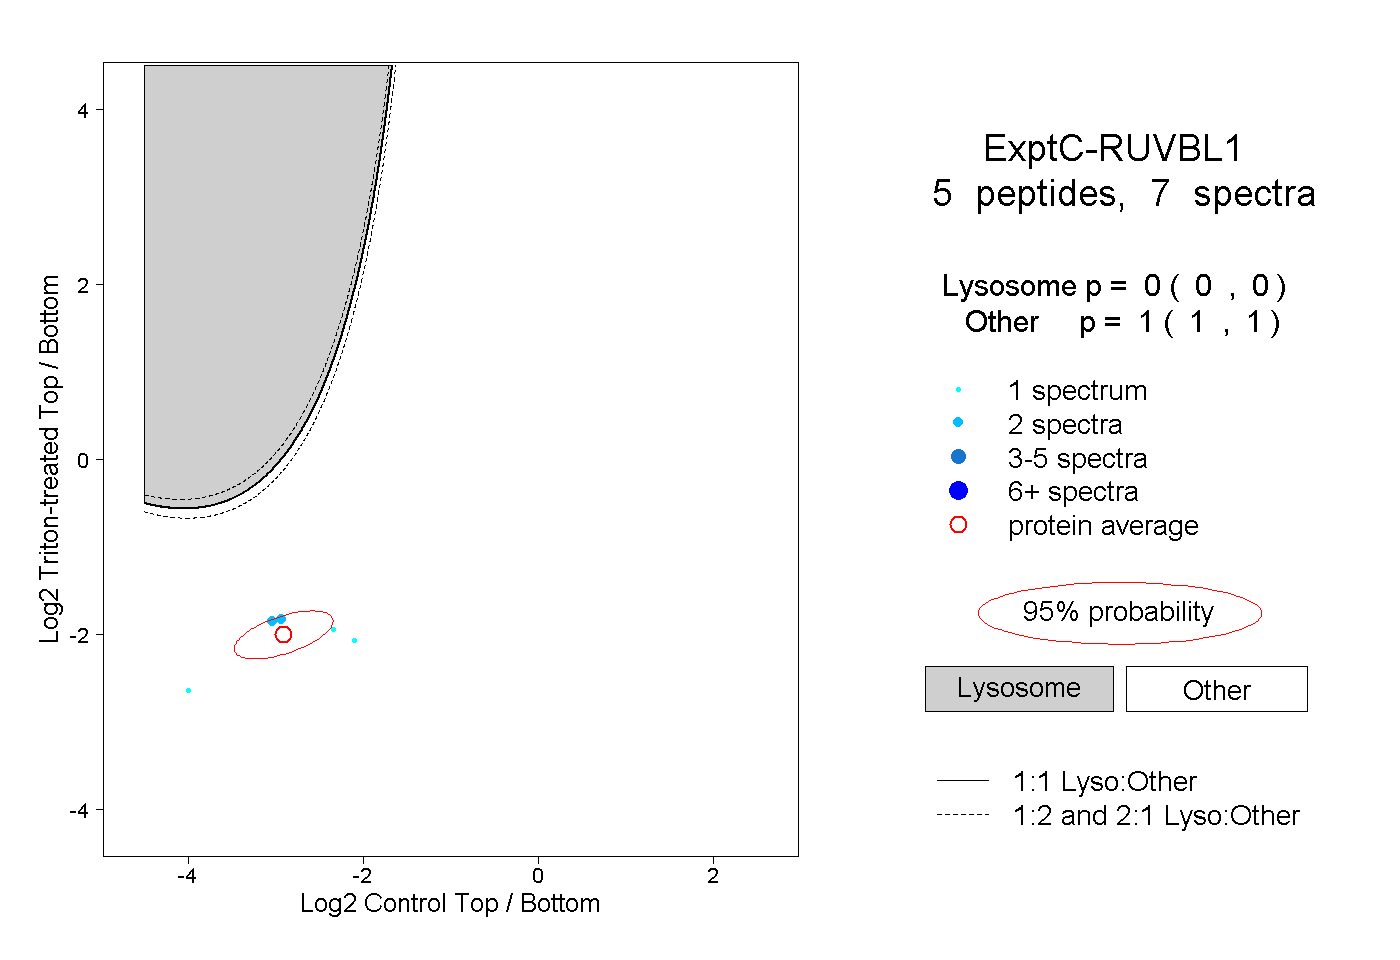 |
0.000 0.000 | 0.000 |
1.000 1.000 | 1.000 |
||||||||
| Plot | Lyso | Other | |||||||||||
| Expt D |
1 peptide |
1 spectrum |
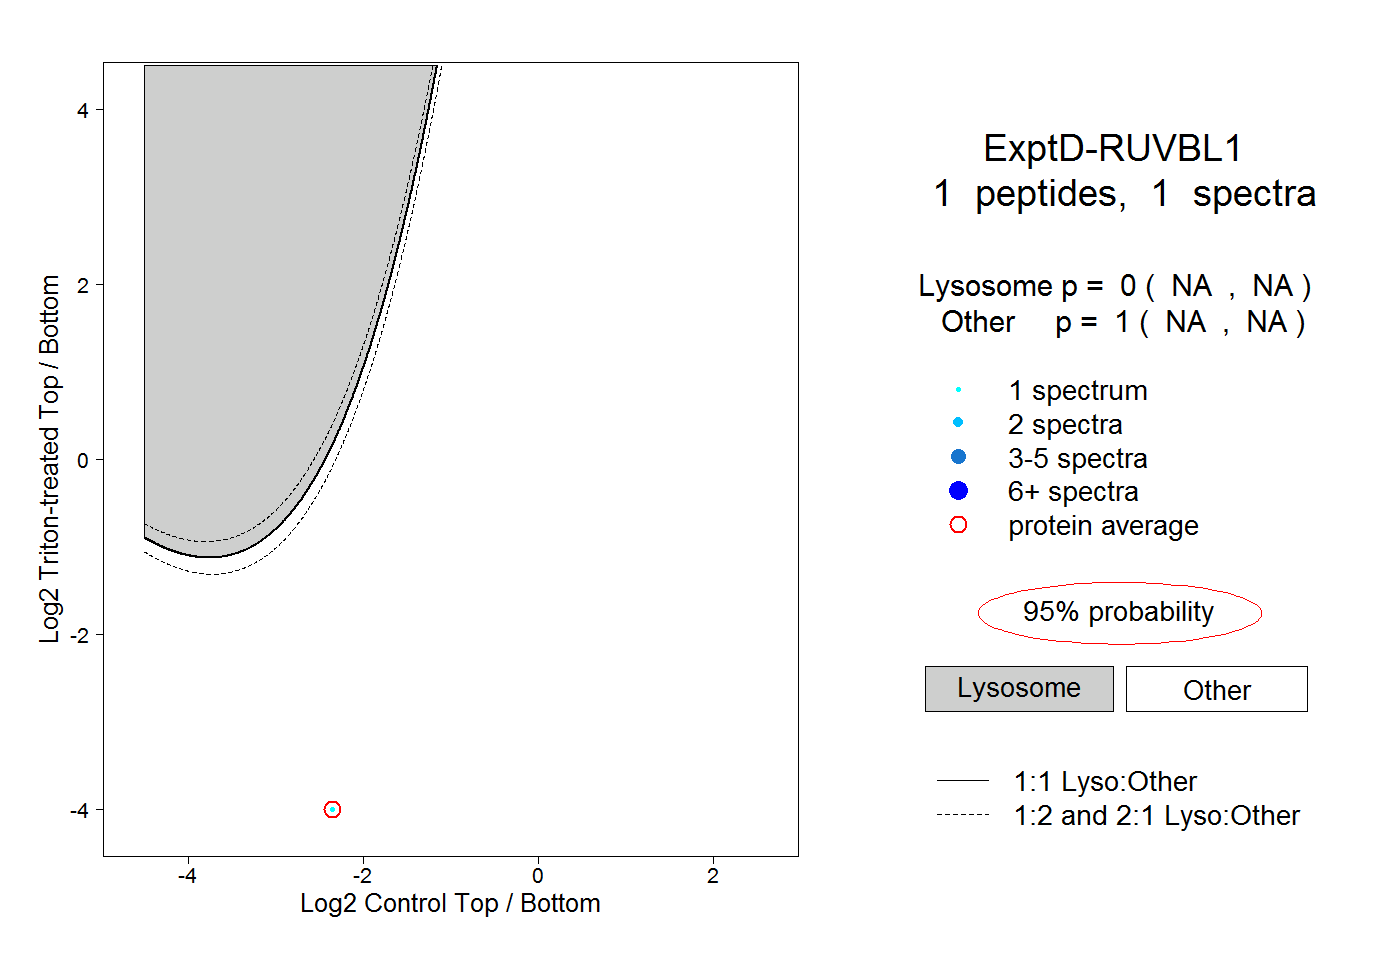 |
0.000 NA | NA |
1.000 NA | NA |