 10
10peptides
spectra
0.000 | 0.000
0.000 | 0.000
0.022 | 0.043
0.955 | 0.976
0.000 | 0.000
0.000 | 0.000
0.000 | 0.000
0.000 | 0.000
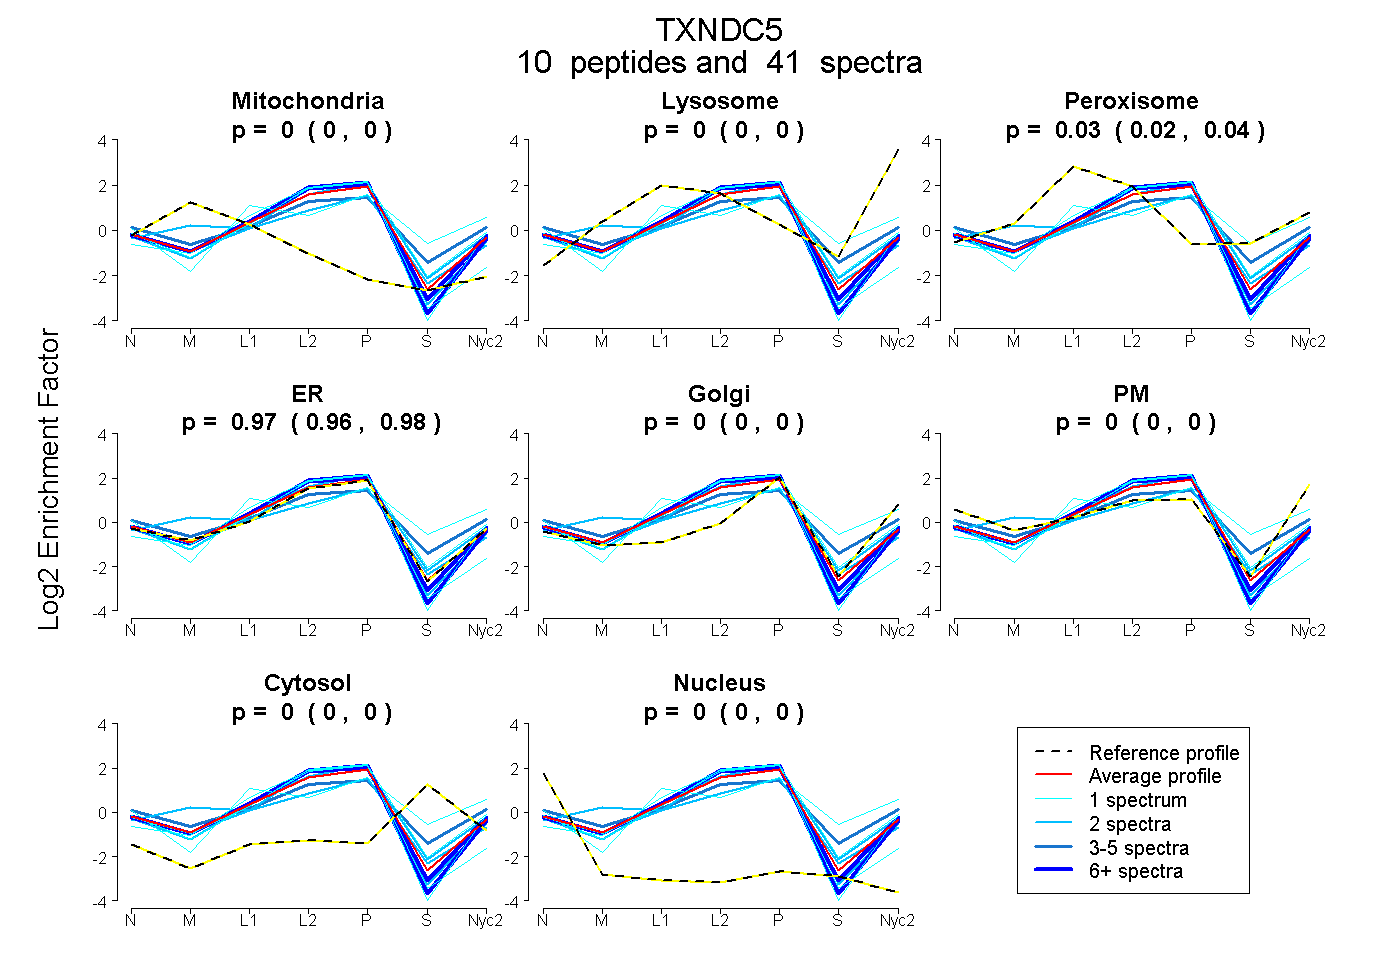
| Plot | Mito | Lyso | Perox | ER | Golgi | PM | Cytosol | Nucleus | |||||
| Expt A |
10 peptides |
41 spectra |
|
0.000 0.000 | 0.000 |
0.000 0.000 | 0.000 |
0.033 0.022 | 0.043 |
0.967 0.955 | 0.976 |
0.000 0.000 | 0.000 |
0.000 0.000 | 0.000 |
0.000 0.000 | 0.000 |
0.000 0.000 | 0.000 |
| 1 spectrum, SFEDTIAQGITFVK | 0.000 | 0.032 | 0.097 | 0.871 | 0.000 | 0.000 | 0.000 | 0.000 | ||
| 19 spectra, GYPTLLLFR | 0.000 | 0.000 | 0.000 | 1.000 | 0.000 | 0.000 | 0.000 | 0.000 | ||
| 4 spectra, DLDSLHSFVLR | 0.000 | 0.000 | 0.113 | 0.569 | 0.000 | 0.206 | 0.112 | 0.000 | ||
| 8 spectra, GYPTLLWFR | 0.000 | 0.000 | 0.000 | 1.000 | 0.000 | 0.000 | 0.000 | 0.000 | ||
| 1 spectrum, NLAPTWEELSK | 0.000 | 0.000 | 0.000 | 1.000 | 0.000 | 0.000 | 0.000 | 0.000 | ||
| 2 spectra, GTVLALTEK | 0.000 | 0.000 | 0.000 | 1.000 | 0.000 | 0.000 | 0.000 | 0.000 | ||
| 2 spectra, FFKPGQEAVK | 0.000 | 0.000 | 0.048 | 0.938 | 0.000 | 0.000 | 0.014 | 0.000 | ||
| 1 spectrum, VDCTANSDVCSAQGVR | 0.000 | 0.000 | 0.000 | 0.962 | 0.000 | 0.000 | 0.000 | 0.038 | ||
| 2 spectra, FYAPWCGHCK | 0.194 | 0.004 | 0.010 | 0.740 | 0.052 | 0.000 | 0.000 | 0.000 | ||
| 1 spectrum, VDCTQHYAVCSEHQVR | 0.000 | 0.000 | 0.334 | 0.146 | 0.384 | 0.000 | 0.136 | 0.000 |
| Plot | Mito | Lyso or Perox | ER | Golgi | PM | Cytosol | Nucleus | ||||||
| Expt B |
7 peptides |
16 spectra |
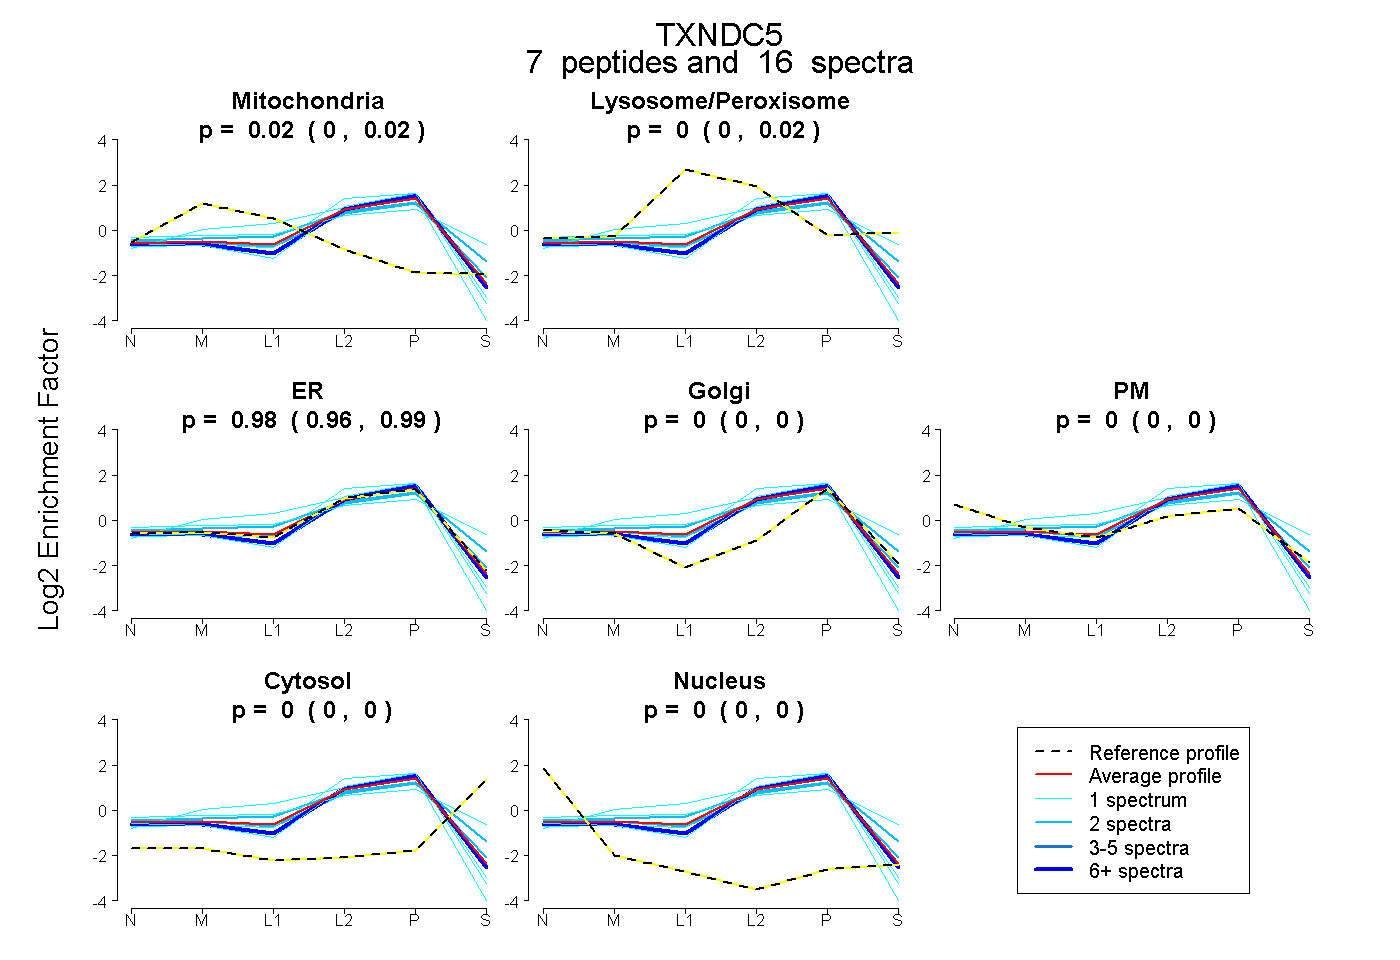 |
0.016 0.002 | 0.023 |
0.000 0.000 | 0.018 |
0.984 0.964 | 0.993 |
0.000 0.000 | 0.000 |
0.000 0.000 | 0.000 |
0.000 0.000 | 0.000 |
0.000 0.000 | 0.000 |
|||
| Plot | Lyso | Other | |||||||||||
| Expt C |
11 peptides |
74 spectra |
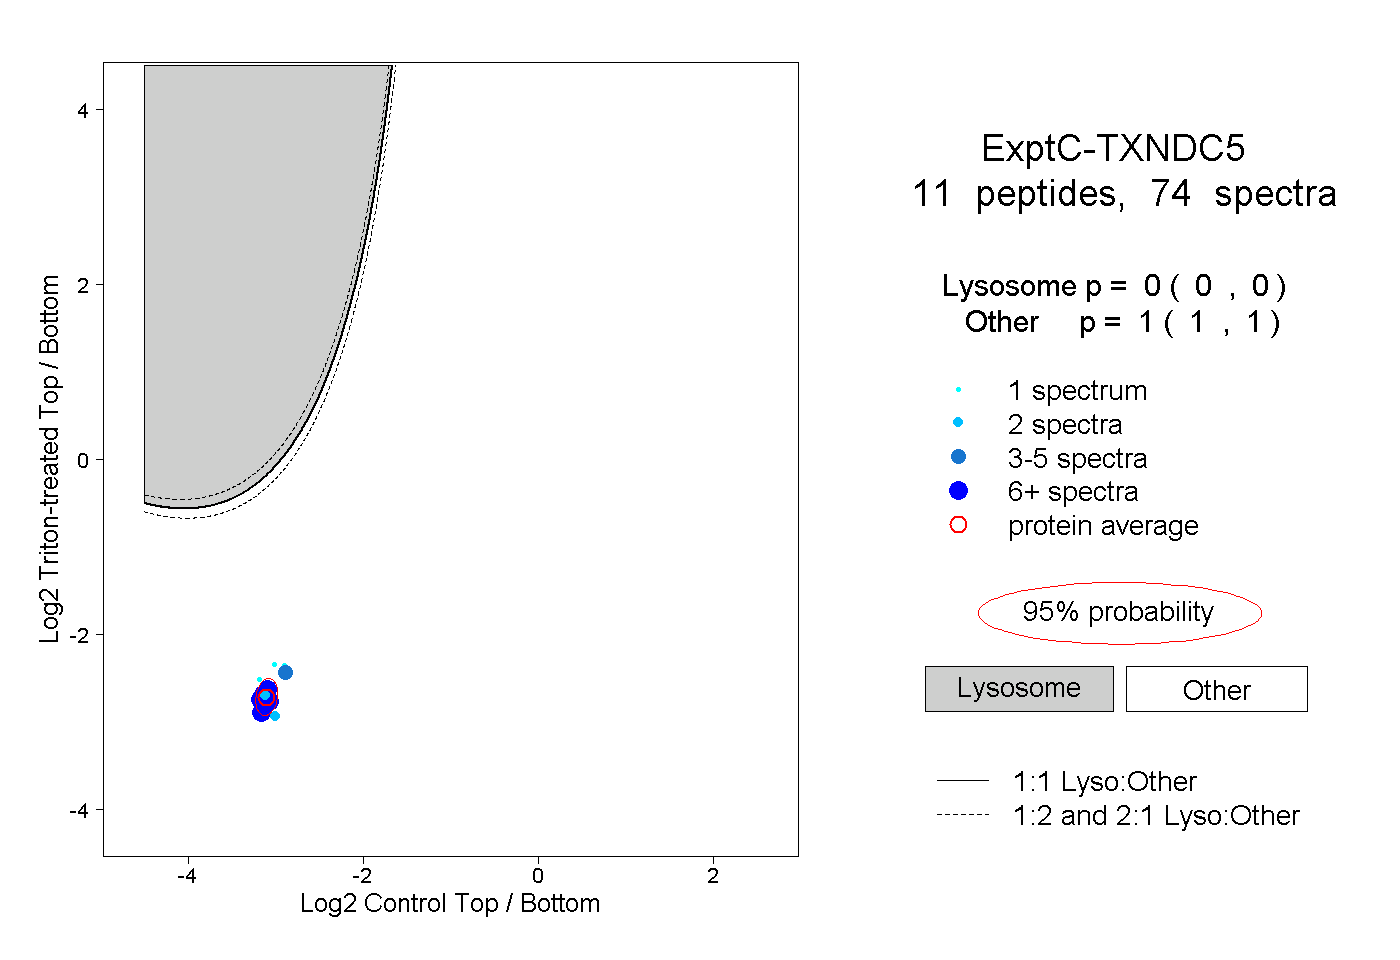 |
0.000 0.000 | 0.000 |
1.000 1.000 | 1.000 |
||||||||
| Plot | Lyso | Other | |||||||||||
| Expt D |
4 peptides |
5 spectra |
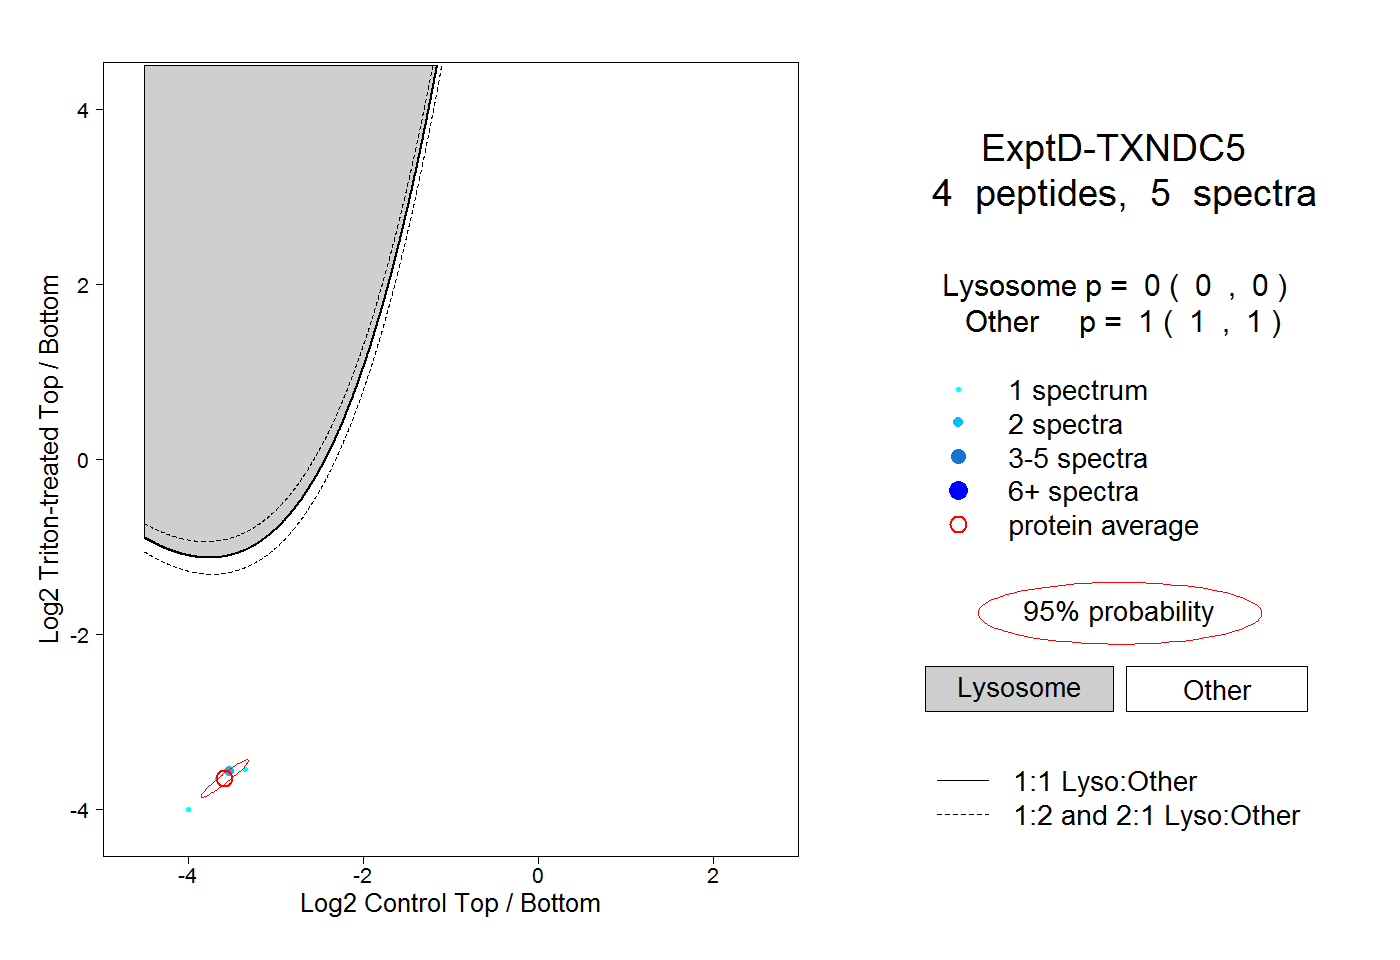 |
0.000 0.000 | 0.000 |
1.000 1.000 | 1.000 |