9
9peptides
spectra
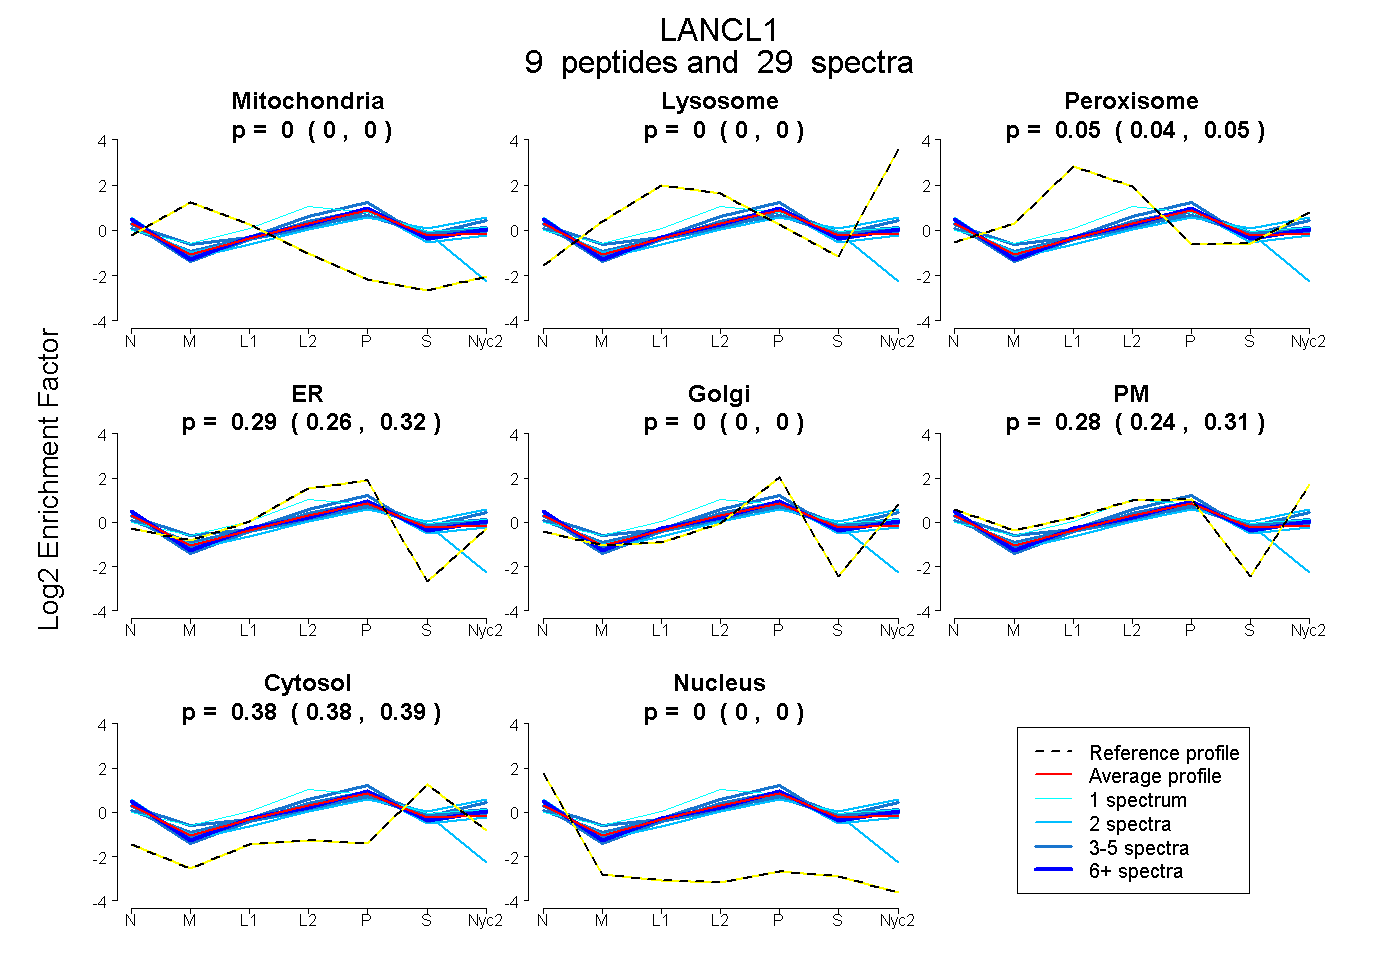
0.000 | 0.000
0.000 | 0.000
0.038 | 0.050
0.262 | 0.318
0.000 | 0.000
0.243 | 0.310
0.378 | 0.387
0.000 | 0.000
4peptides
spectra
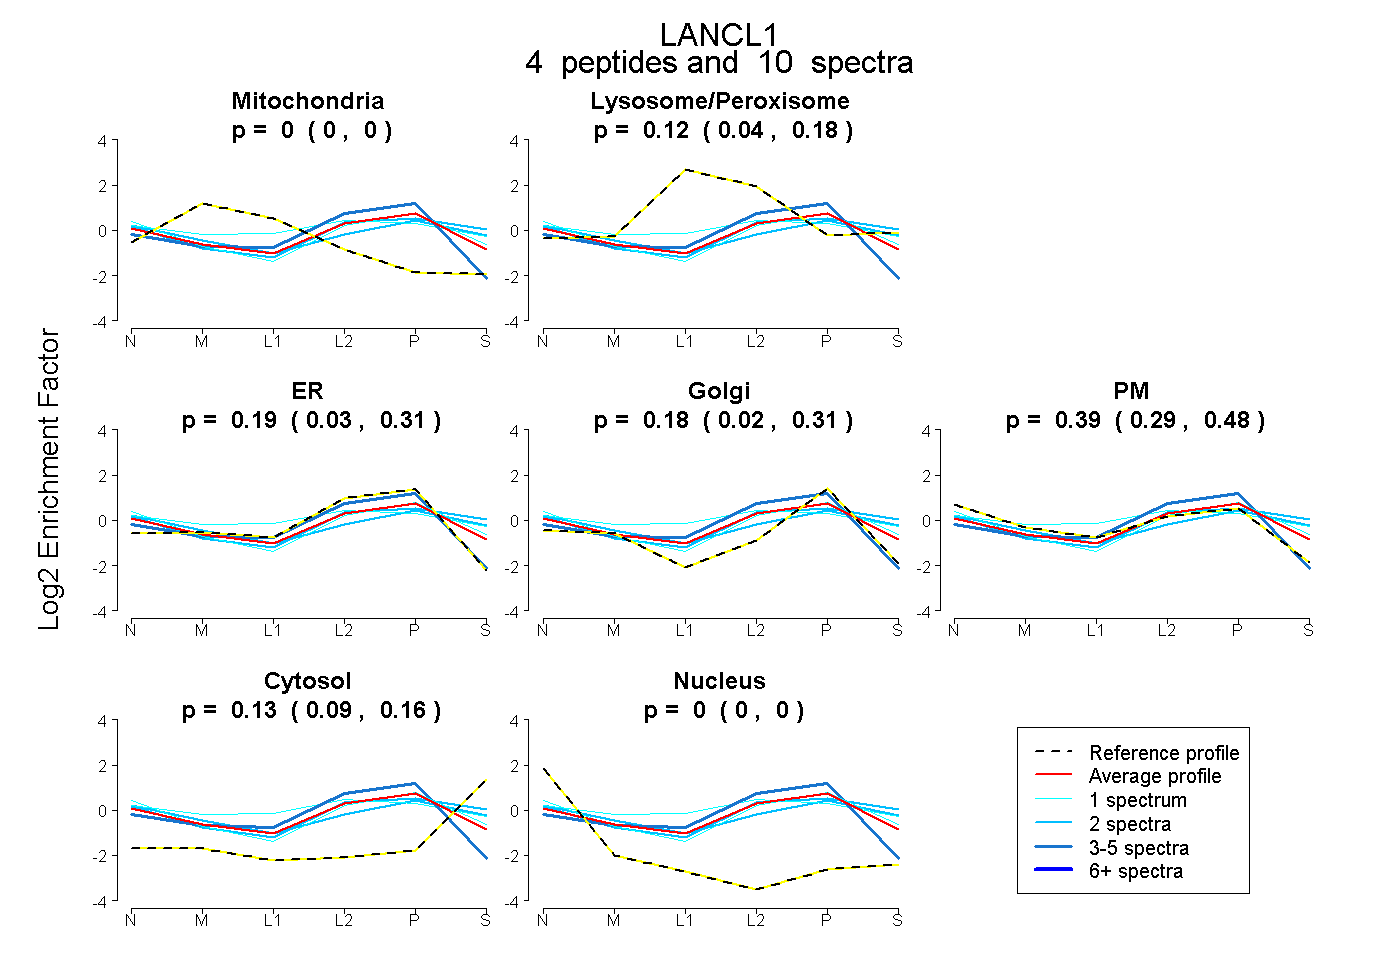
0.000 | 0.000
0.040 | 0.185
0.035 | 0.312
0.022 | 0.315
0.289 | 0.477
0.094 | 0.161
0.000 | 0.000
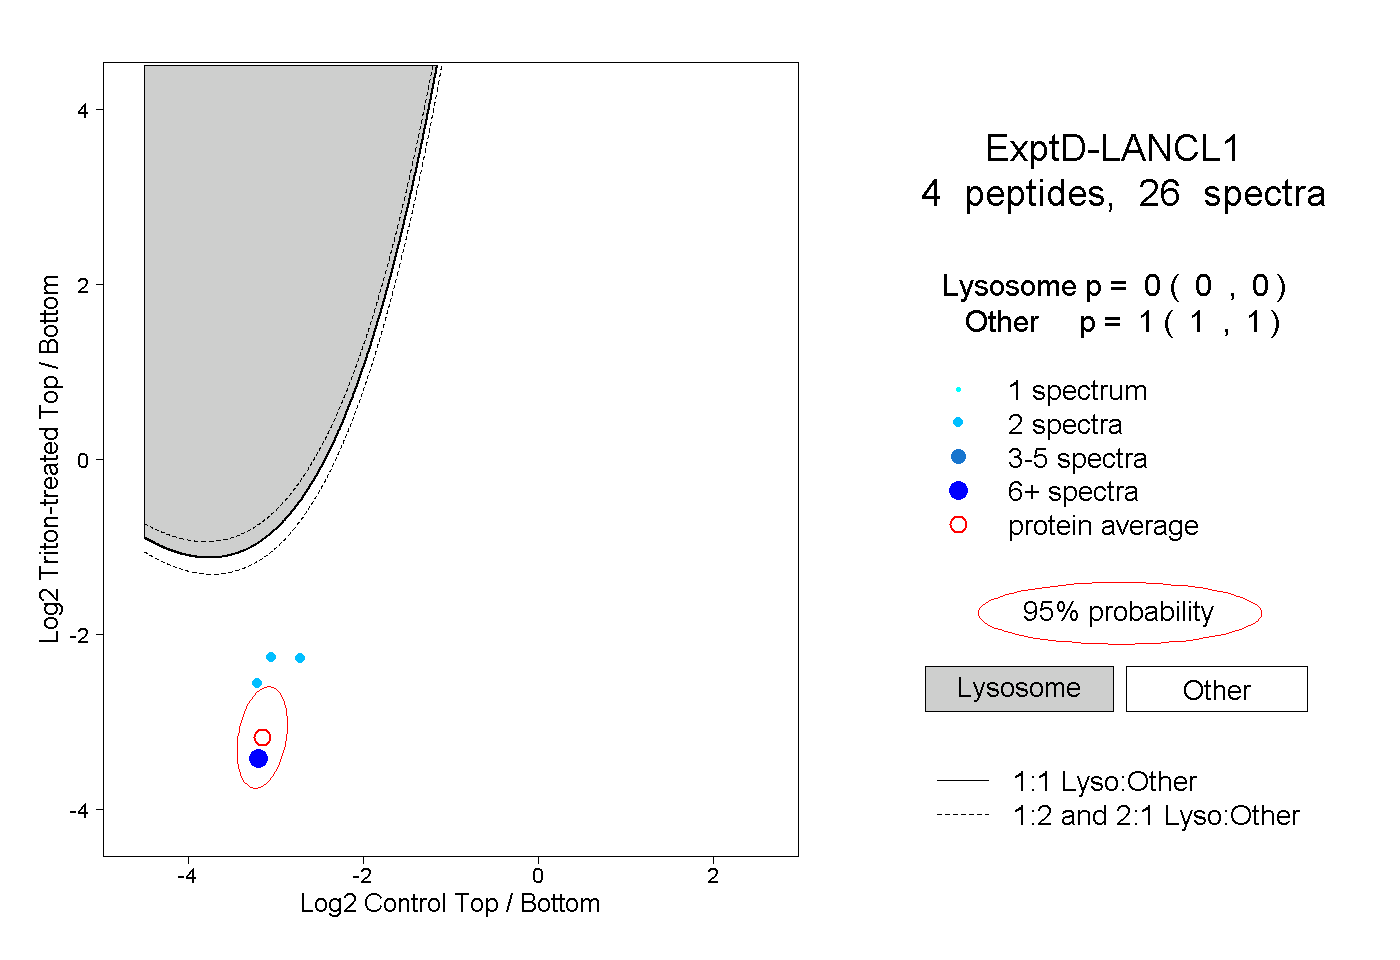
11peptides
spectra
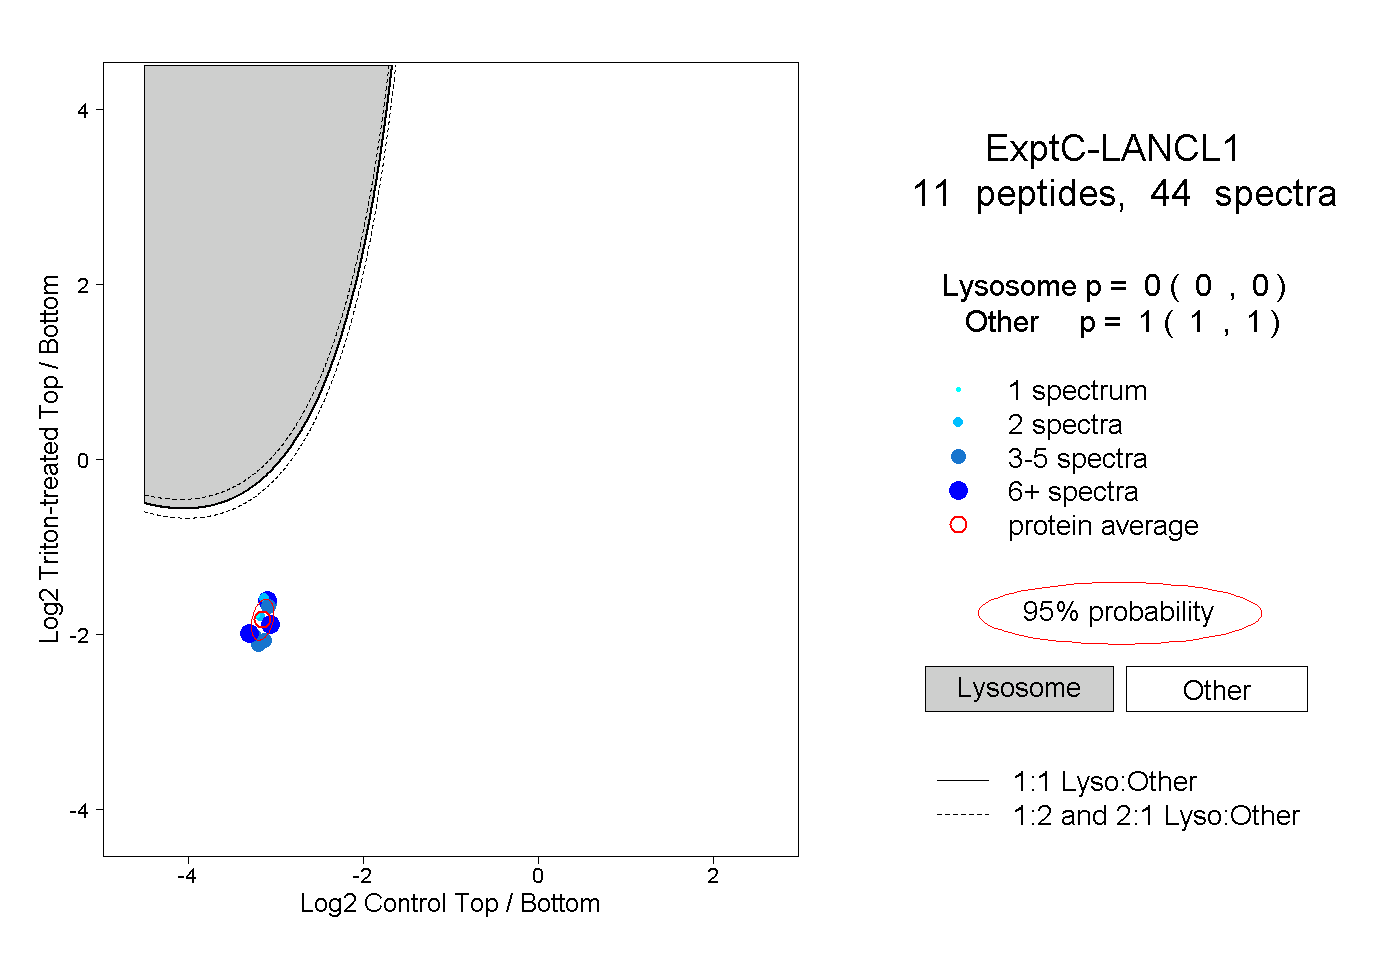
0.000 | 0.000
1.000 | 1.000