 9
9peptides
spectra
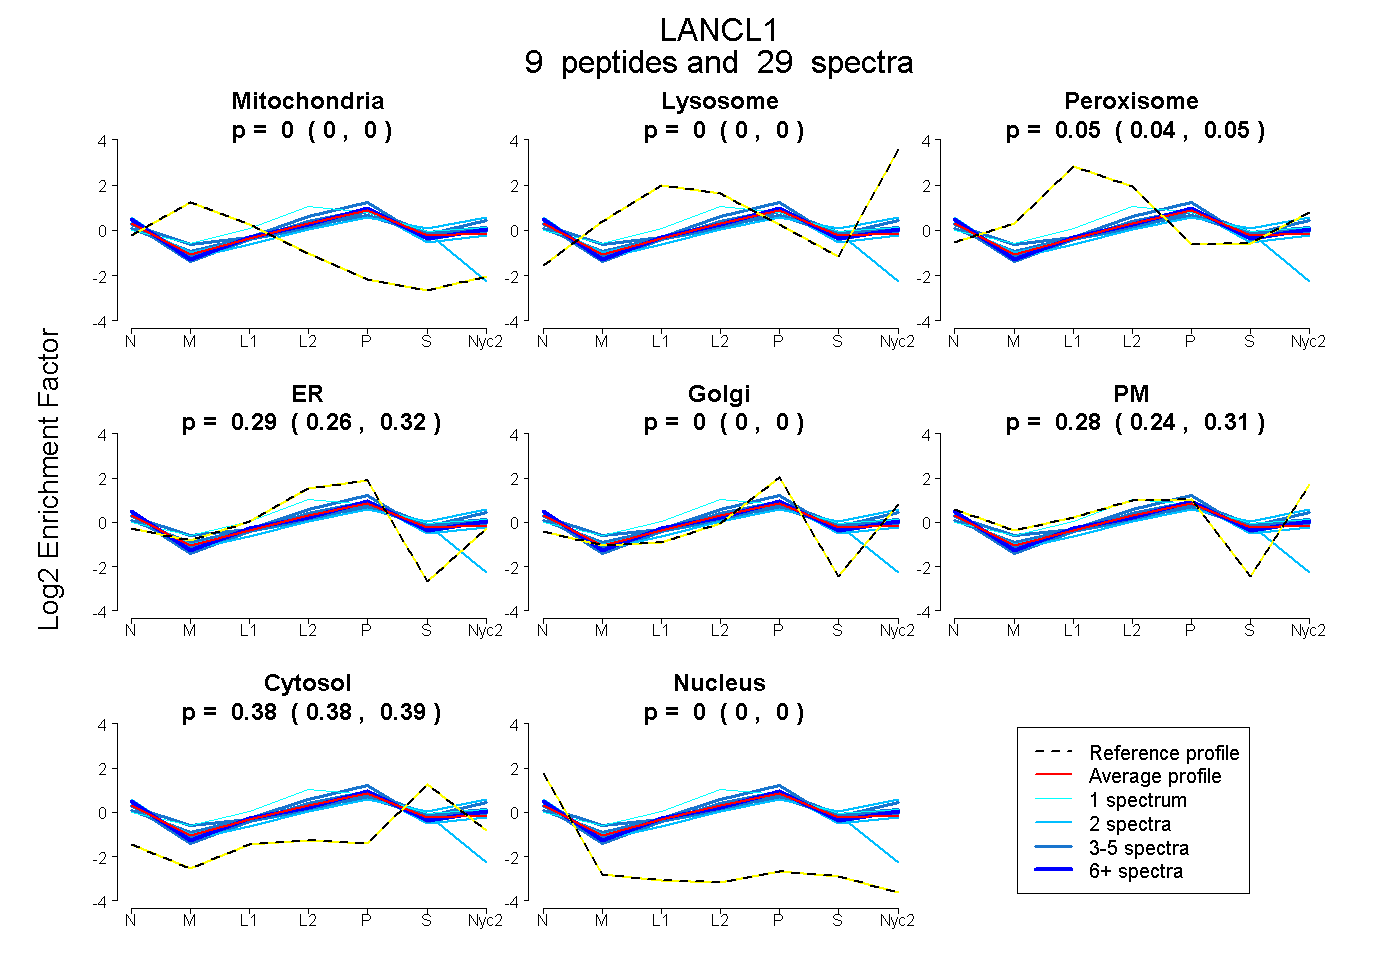
0.000 | 0.000
0.000 | 0.000
0.038 | 0.050
0.262 | 0.318
0.000 | 0.000
0.243 | 0.310
0.378 | 0.387
0.000 | 0.000
| Plot | Mito | Lyso | Perox | ER | Golgi | PM | Cytosol | Nucleus | |||||
| Expt A |
9 peptides |
29 spectra |
|
0.000 0.000 | 0.000 |
0.000 0.000 | 0.000 |
0.045 0.038 | 0.050 |
0.292 0.262 | 0.318 |
0.000 0.000 | 0.000 |
0.280 0.243 | 0.310 |
0.383 0.378 | 0.387 |
0.000 0.000 | 0.000 |
| 2 spectra, AFPNPYADYNK | 0.000 | 0.000 | 0.013 | 0.335 | 0.000 | 0.294 | 0.340 | 0.019 | ||
| 4 spectra, LTPEFSHR | 0.000 | 0.000 | 0.018 | 0.245 | 0.000 | 0.340 | 0.397 | 0.000 | ||
| 4 spectra, ELLQQMER | 0.000 | 0.000 | 0.072 | 0.357 | 0.058 | 0.211 | 0.302 | 0.000 | ||
| 3 spectra, FPSGNYPSCLDDTR | 0.000 | 0.000 | 0.018 | 0.234 | 0.000 | 0.338 | 0.409 | 0.000 | ||
| 2 spectra, NFGEEK | 0.000 | 0.000 | 0.000 | 0.000 | 0.000 | 0.553 | 0.447 | 0.000 | ||
| 6 spectra, SLAENYFDSTGR | 0.000 | 0.000 | 0.002 | 0.250 | 0.000 | 0.376 | 0.372 | 0.000 | ||
| 2 spectra, FAEWCLDYGEHGCR | 0.067 | 0.000 | 0.012 | 0.469 | 0.000 | 0.000 | 0.364 | 0.088 | ||
| 1 spectrum, QAEDCITR | 0.000 | 0.000 | 0.251 | 0.301 | 0.000 | 0.162 | 0.286 | 0.000 | ||
| 5 spectra, IDPHVPNEMLYGR | 0.000 | 0.000 | 0.106 | 0.009 | 0.079 | 0.458 | 0.348 | 0.000 |
| Plot | Mito | Lyso or Perox | ER | Golgi | PM | Cytosol | Nucleus | ||||||
| Expt B |
4 peptides |
10 spectra |
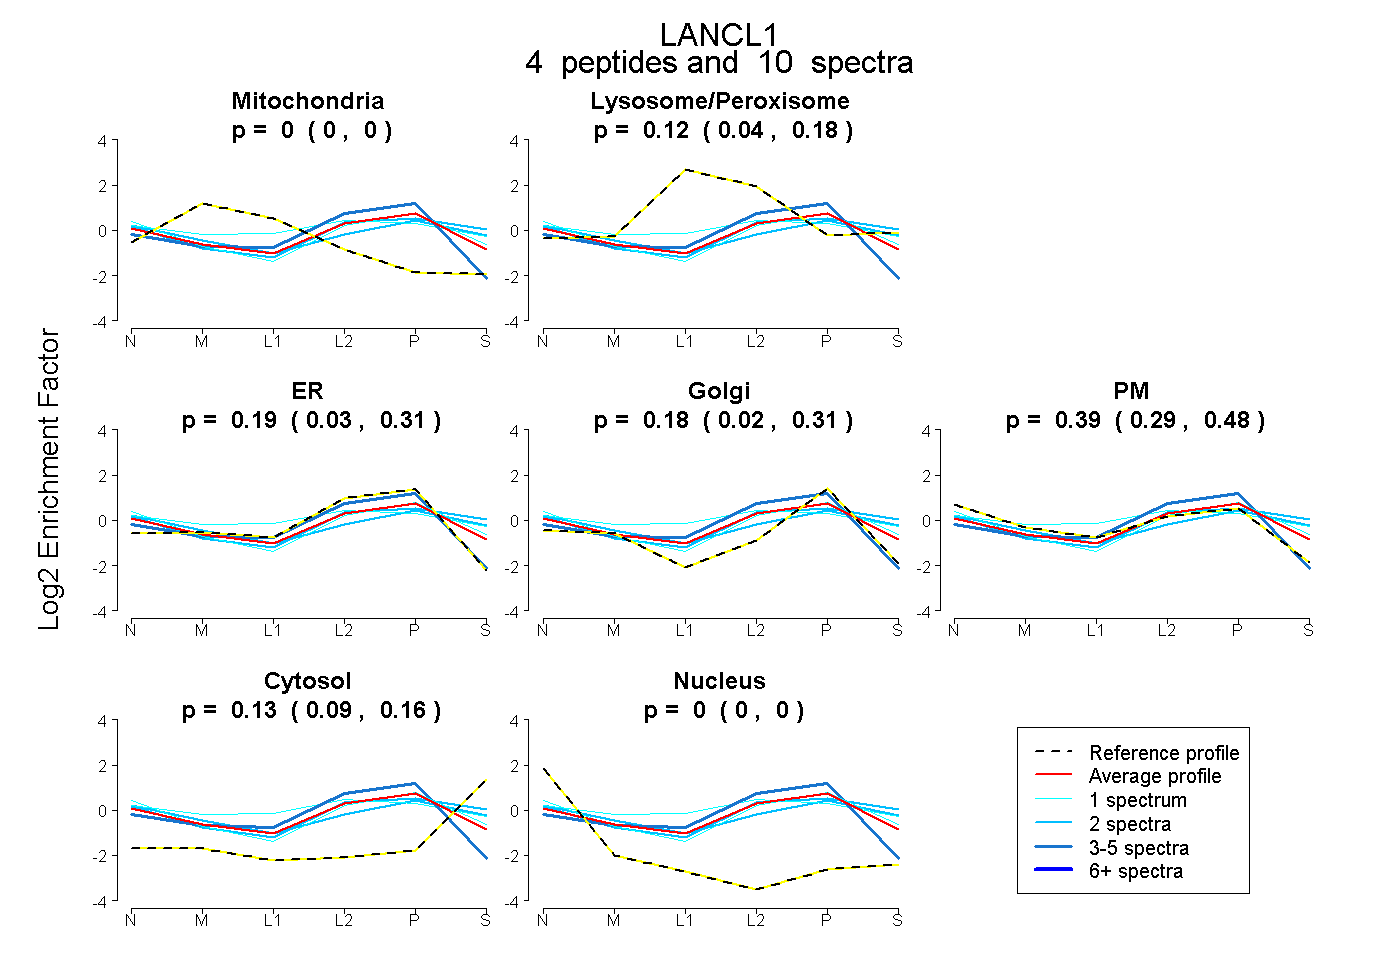 |
0.000 0.000 | 0.000 |
0.116 0.040 | 0.185 |
0.187 0.035 | 0.312 |
0.175 0.022 | 0.315 |
0.391 0.289 | 0.477 |
0.131 0.094 | 0.161 |
0.000 0.000 | 0.000 |
|||
| Plot | Lyso | Other | |||||||||||
| Expt C |
11 peptides |
44 spectra |
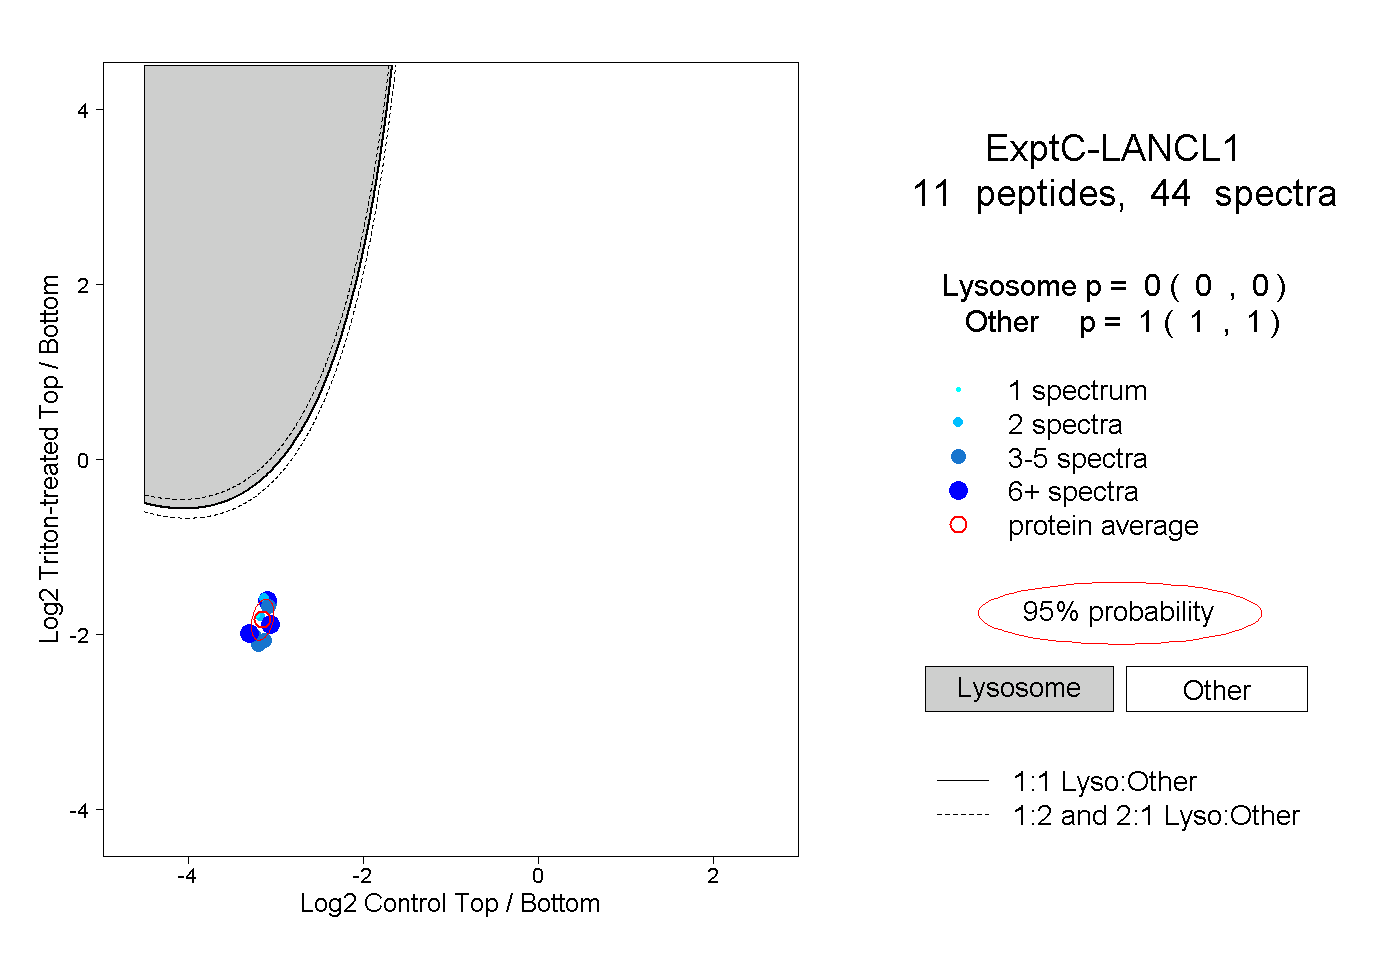 |
0.000 0.000 | 0.000 |
1.000 1.000 | 1.000 |
||||||||
| Plot | Lyso | Other | |||||||||||
| Expt D |
4 peptides |
26 spectra |
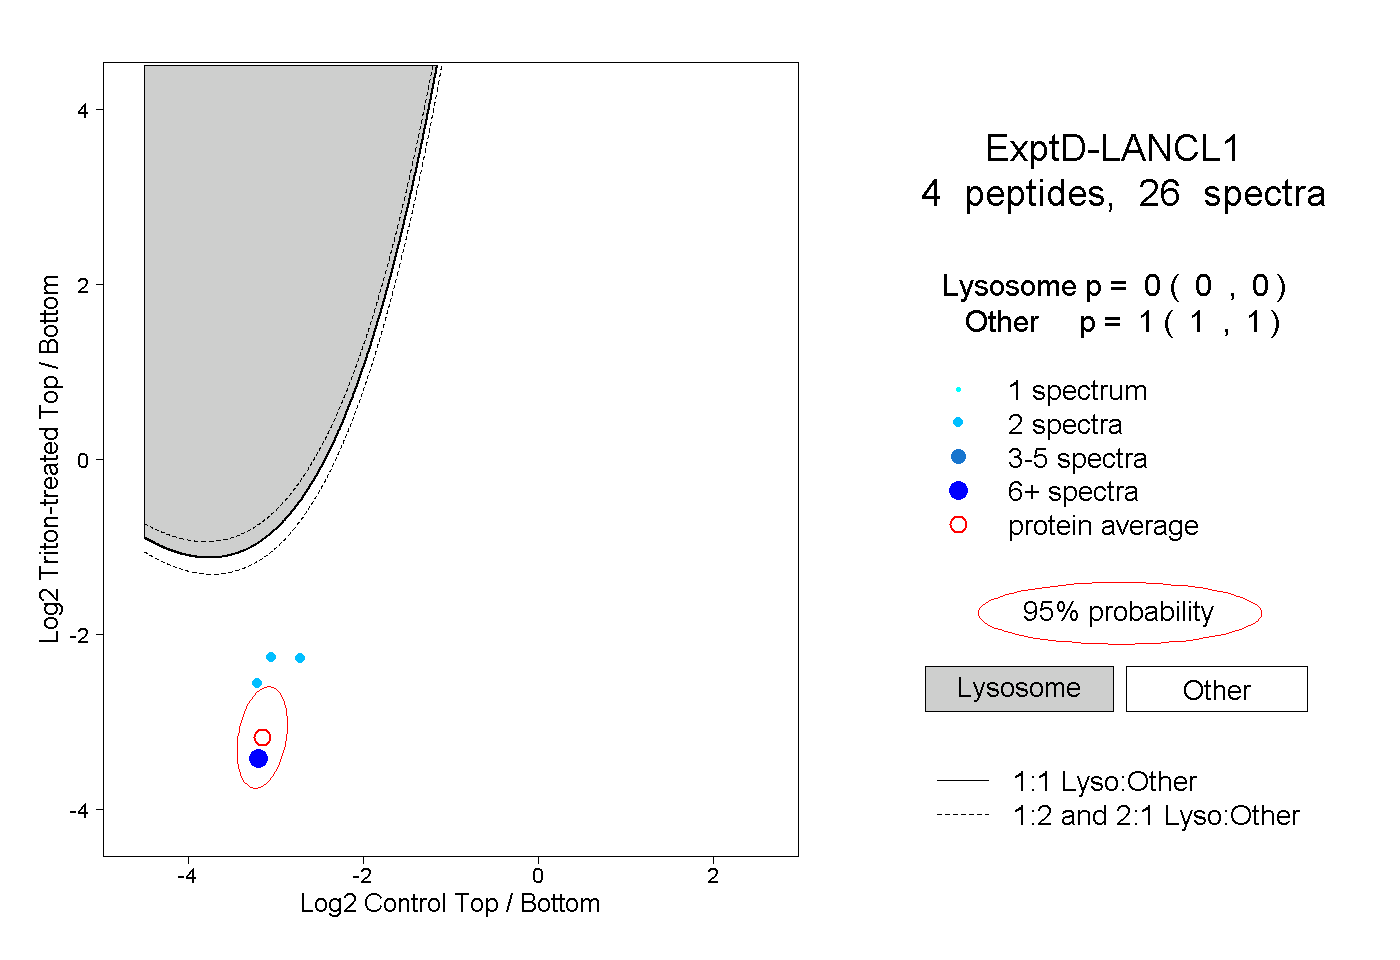 |
0.000 0.000 | 0.000 |
1.000 1.000 | 1.000 |