 2
2peptides
spectra
0.000 | 0.111
0.000 | 0.000
0.000 | 0.111
0.000 | 0.301
0.000 | 0.304
0.000 | 0.209
0.451 | 0.645
0.014 | 0.155
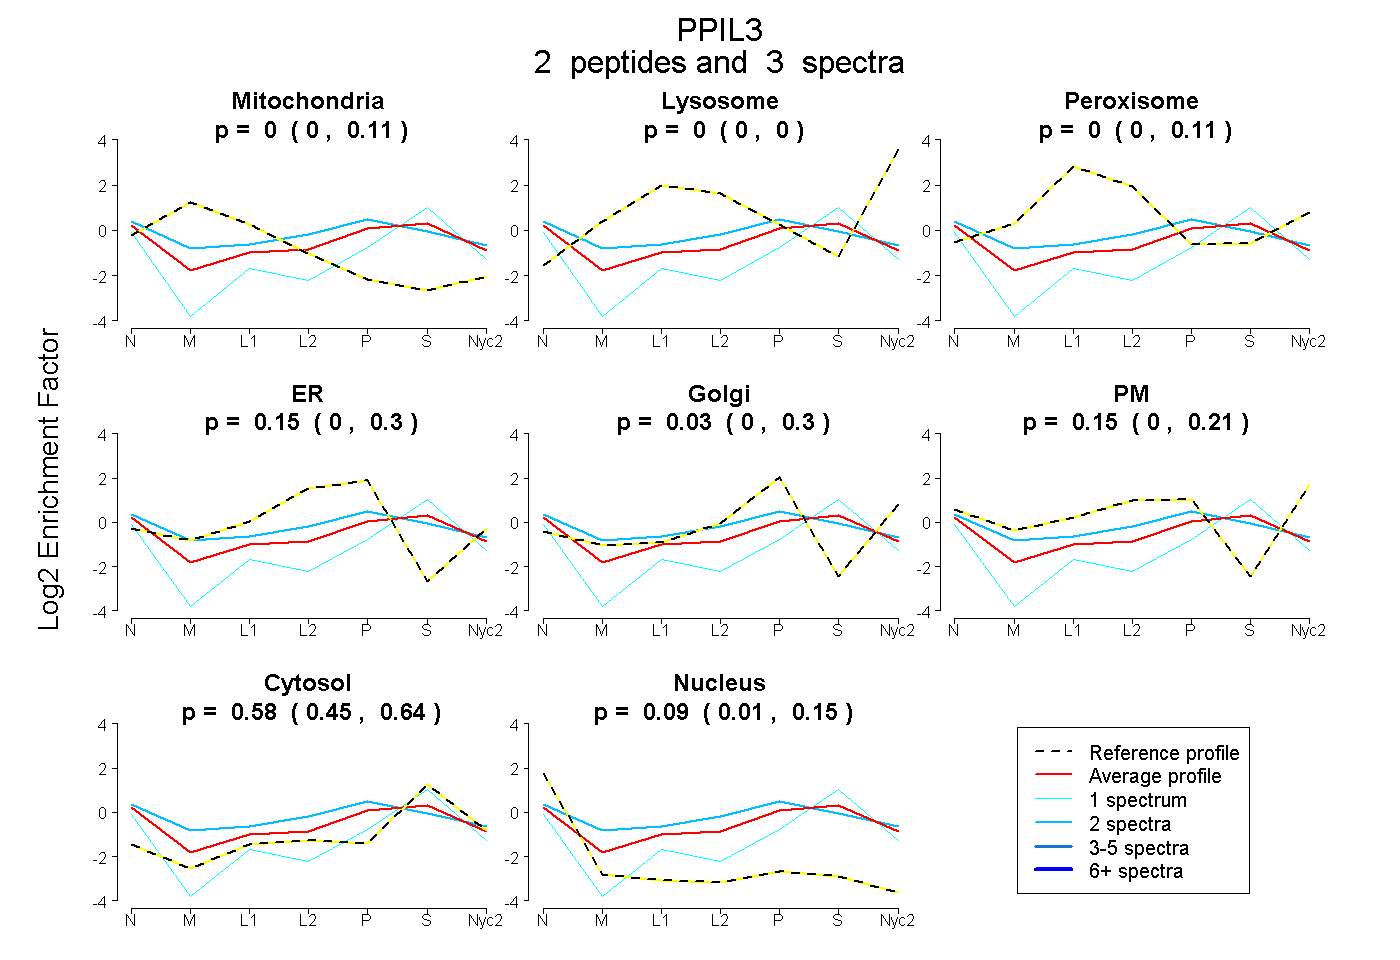
| Plot | Mito | Lyso | Perox | ER | Golgi | PM | Cytosol | Nucleus | |||||
| Expt A |
2 peptides |
3 spectra |
|
0.000 0.000 | 0.111 |
0.000 0.000 | 0.000 |
0.000 0.000 | 0.111 |
0.149 0.000 | 0.301 |
0.032 0.000 | 0.304 |
0.148 0.000 | 0.209 |
0.577 0.451 | 0.645 |
0.095 0.014 | 0.155 |