 10
10peptides
spectra
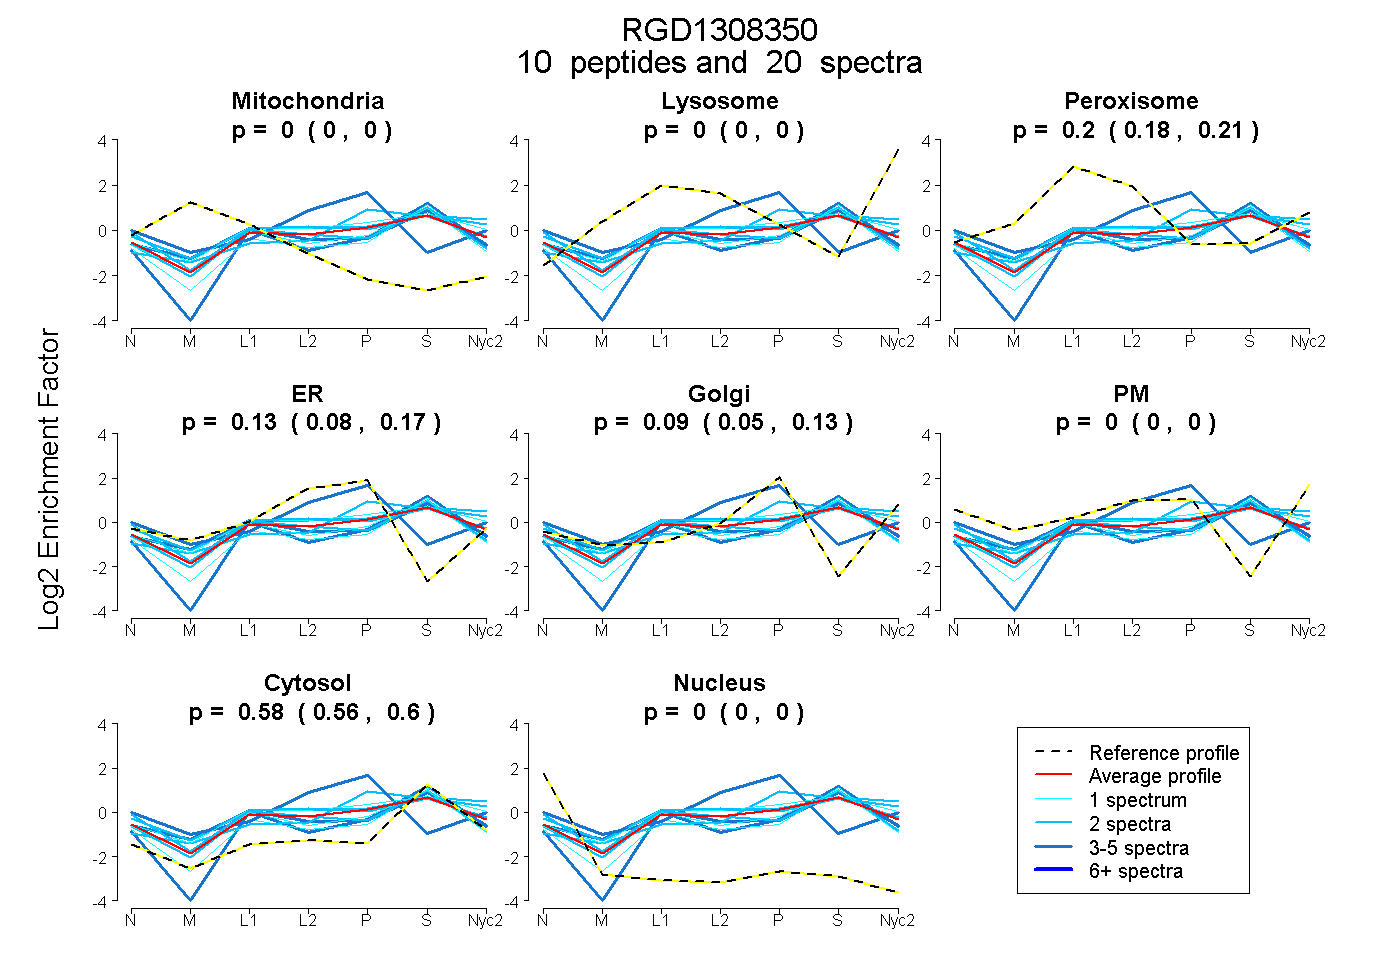
0.000 | 0.000
0.000 | 0.000
0.180 | 0.214
0.081 | 0.168
0.049 | 0.129
0.000 | 0.000
0.563 | 0.597
0.000 | 0.000
2peptides
spectra
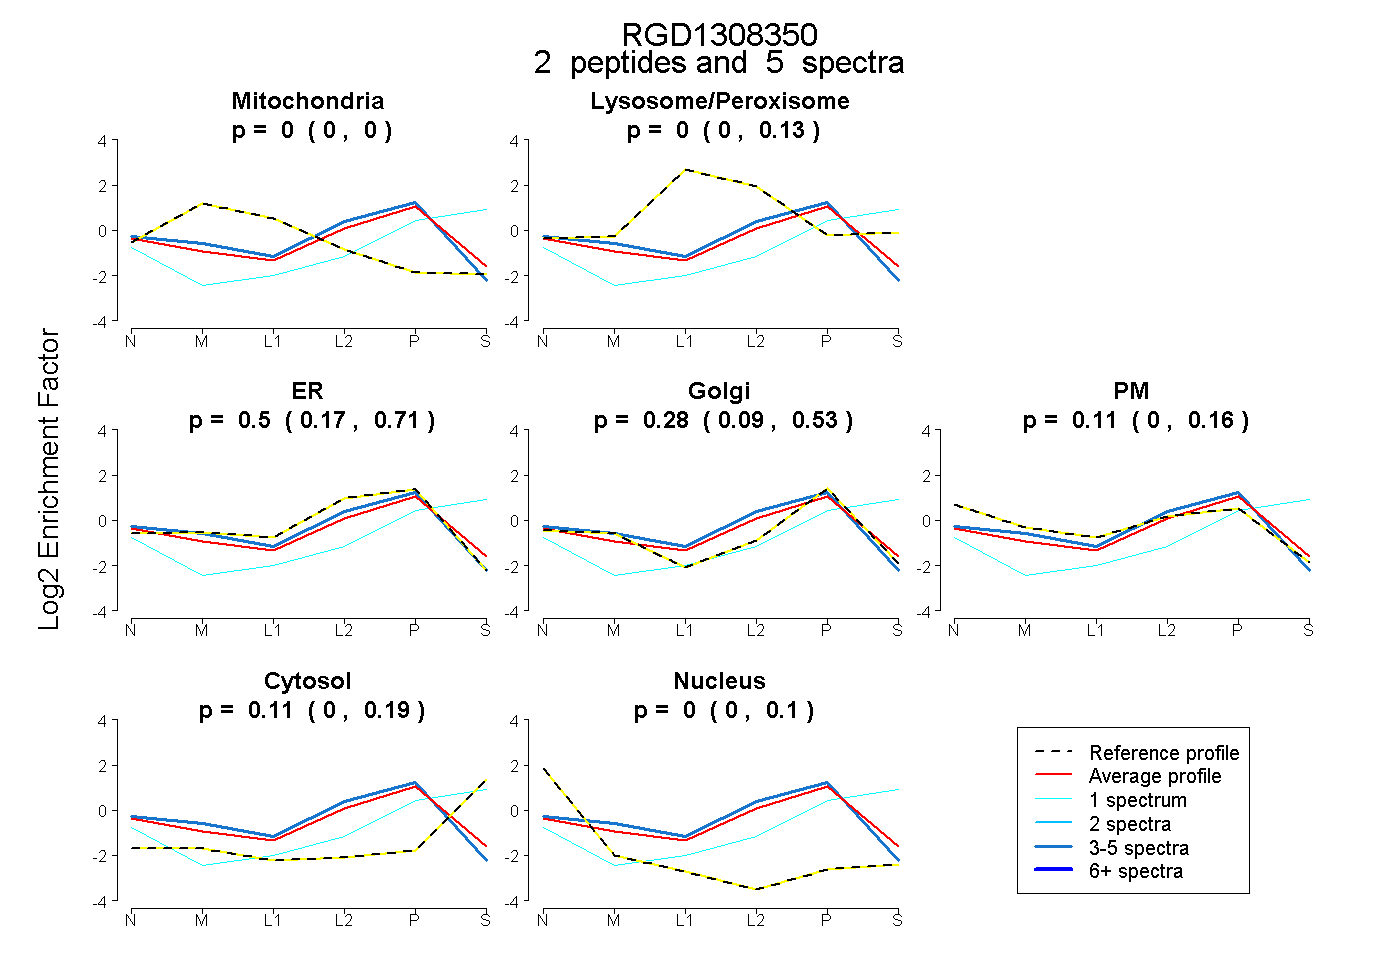
0.000 | 0.000
0.000 | 0.130
0.172 | 0.706
0.086 | 0.535
0.000 | 0.159
0.000 | 0.186
0.000 | 0.101
6peptides
spectra
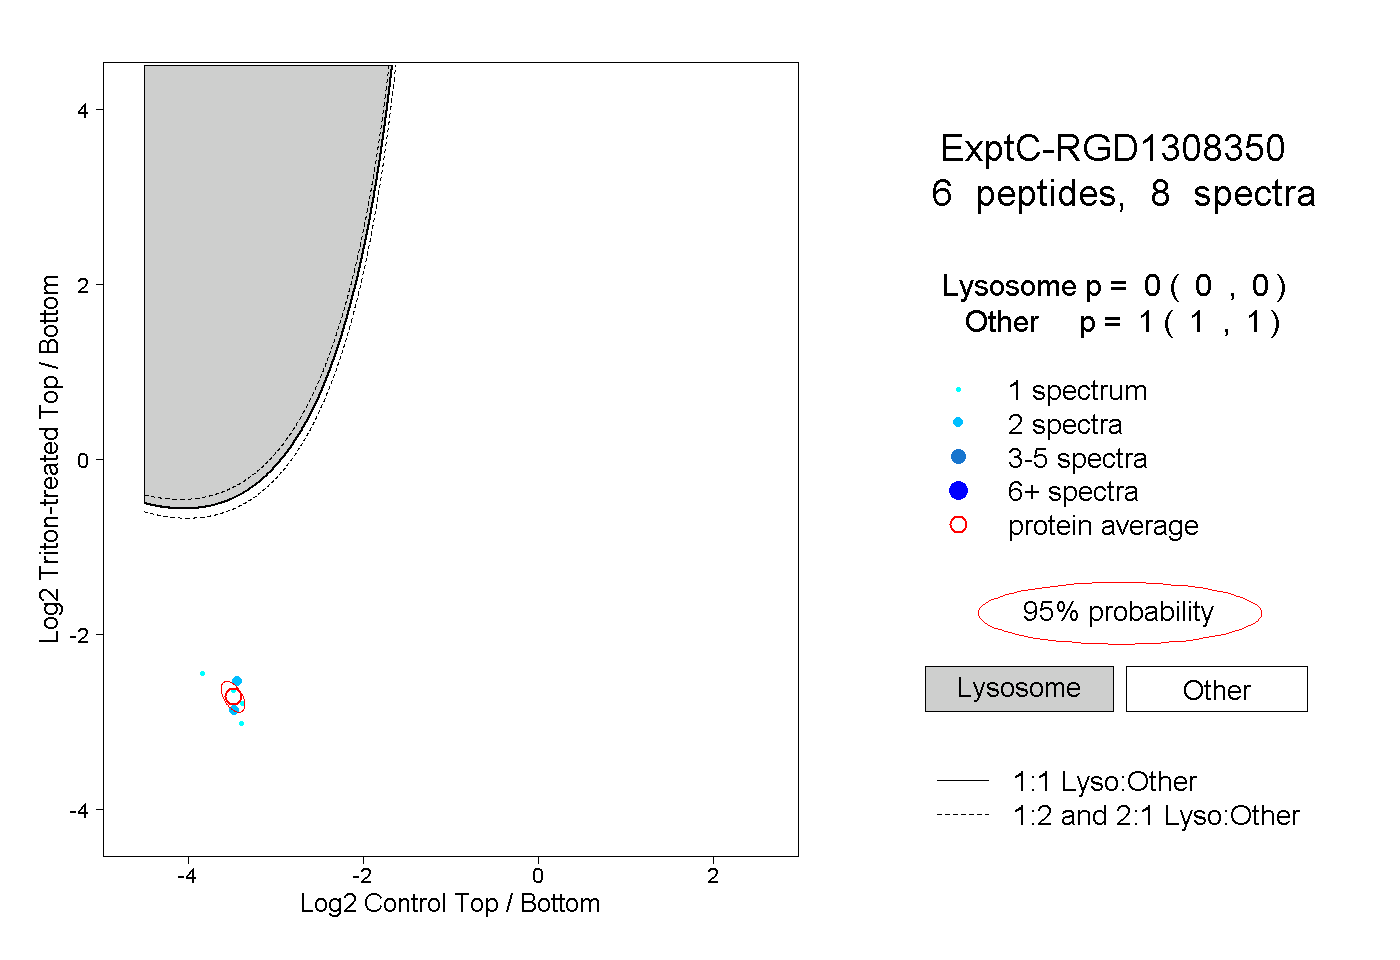
0.000 | 0.000
1.000 | 1.000
2peptides
spectra
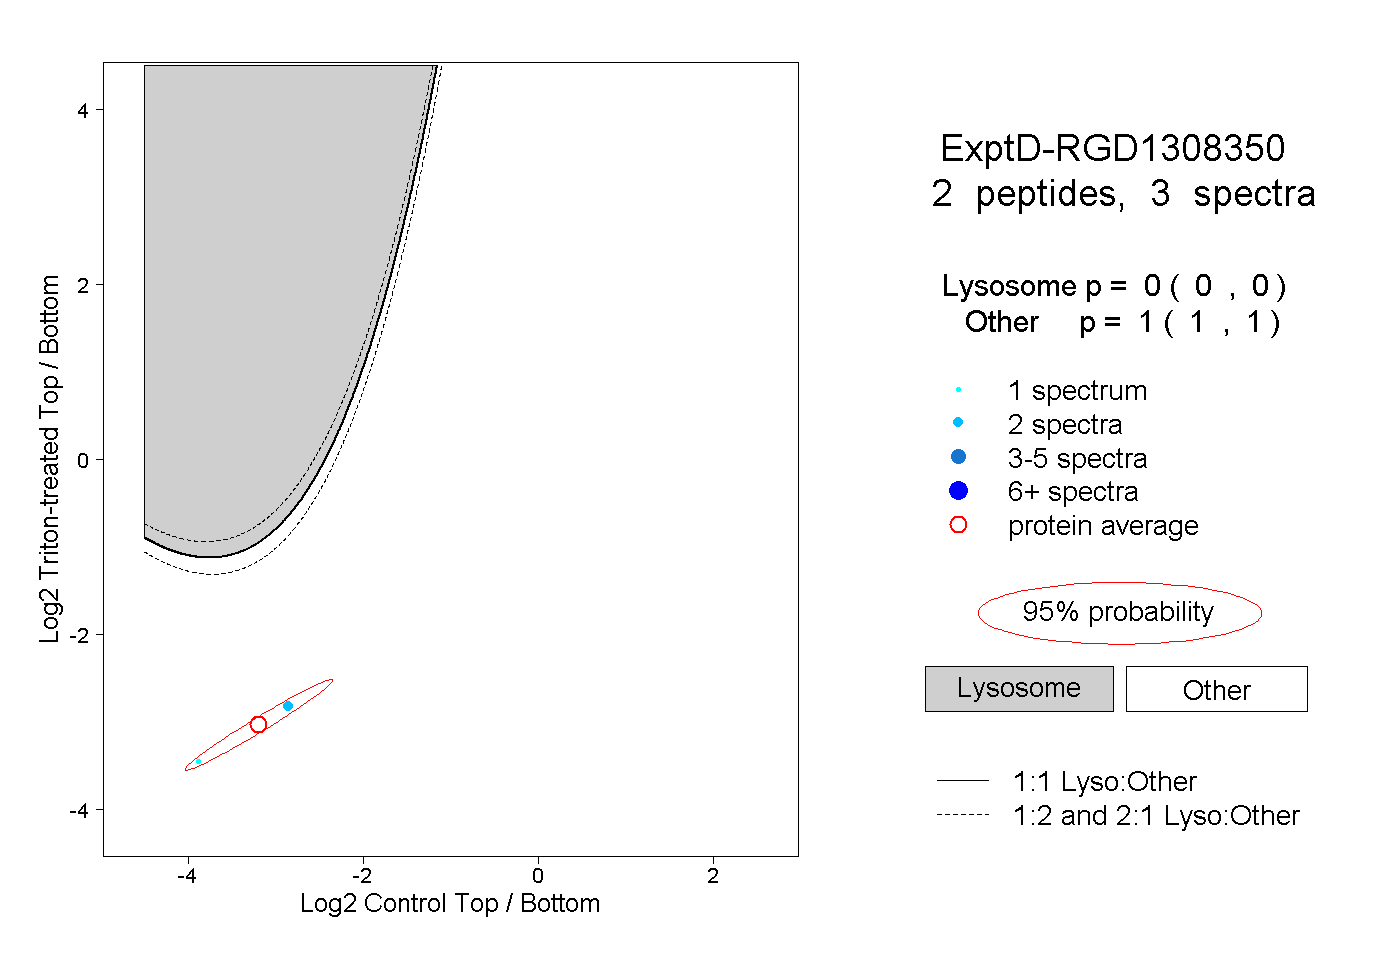
0.000 | 0.000
1.000 | 1.000