 4
4peptides
spectra
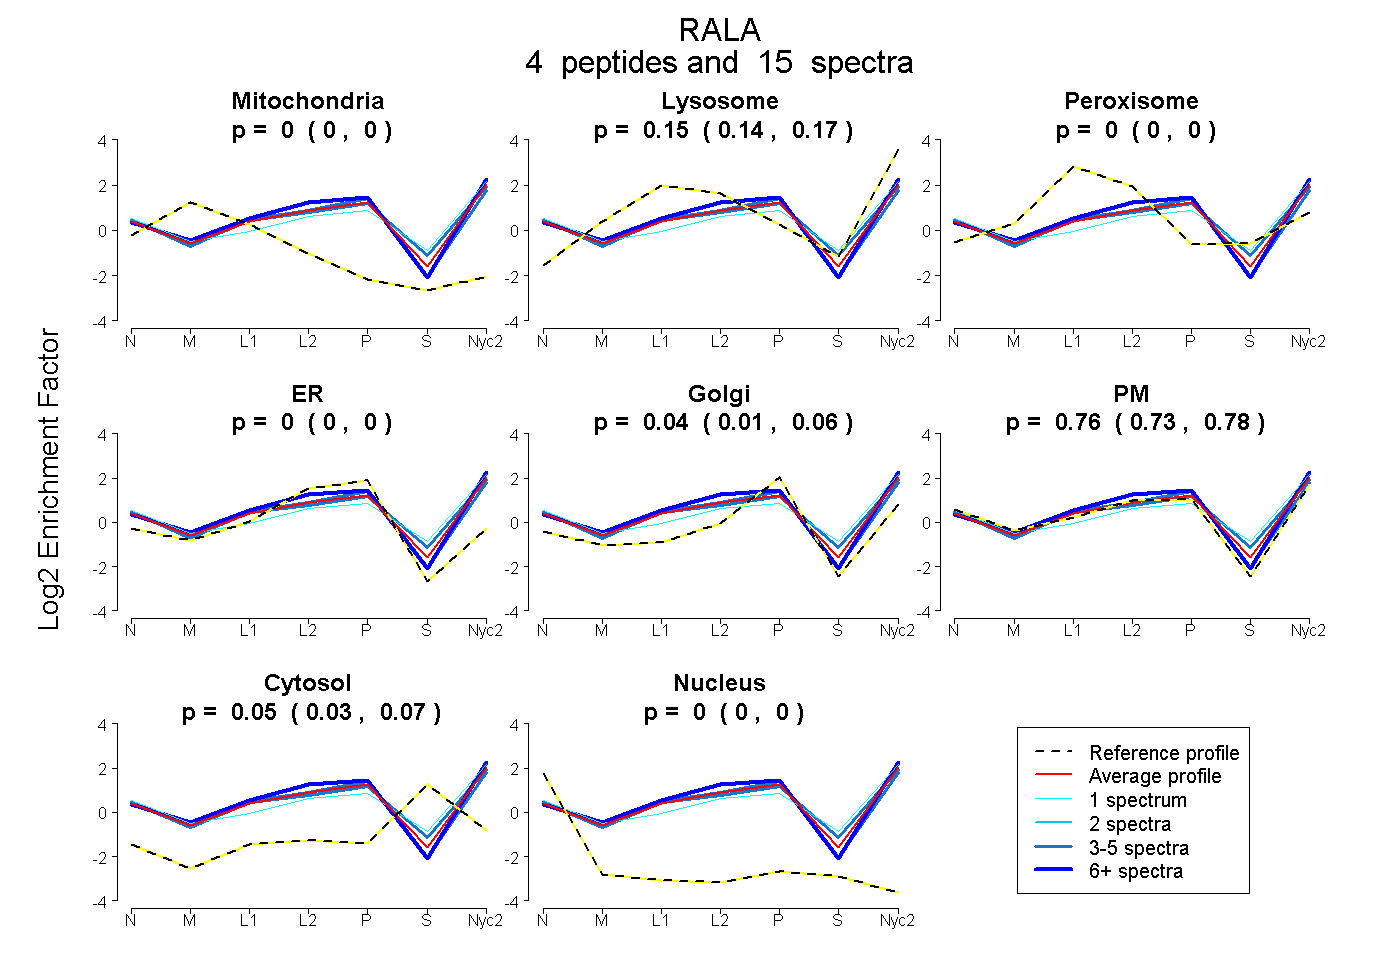
0.000 | 0.000
0.139 | 0.165
0.000 | 0.000
0.000 | 0.000
0.007 | 0.064
0.730 | 0.779
0.033 | 0.066
0.000 | 0.000
3peptides
spectra
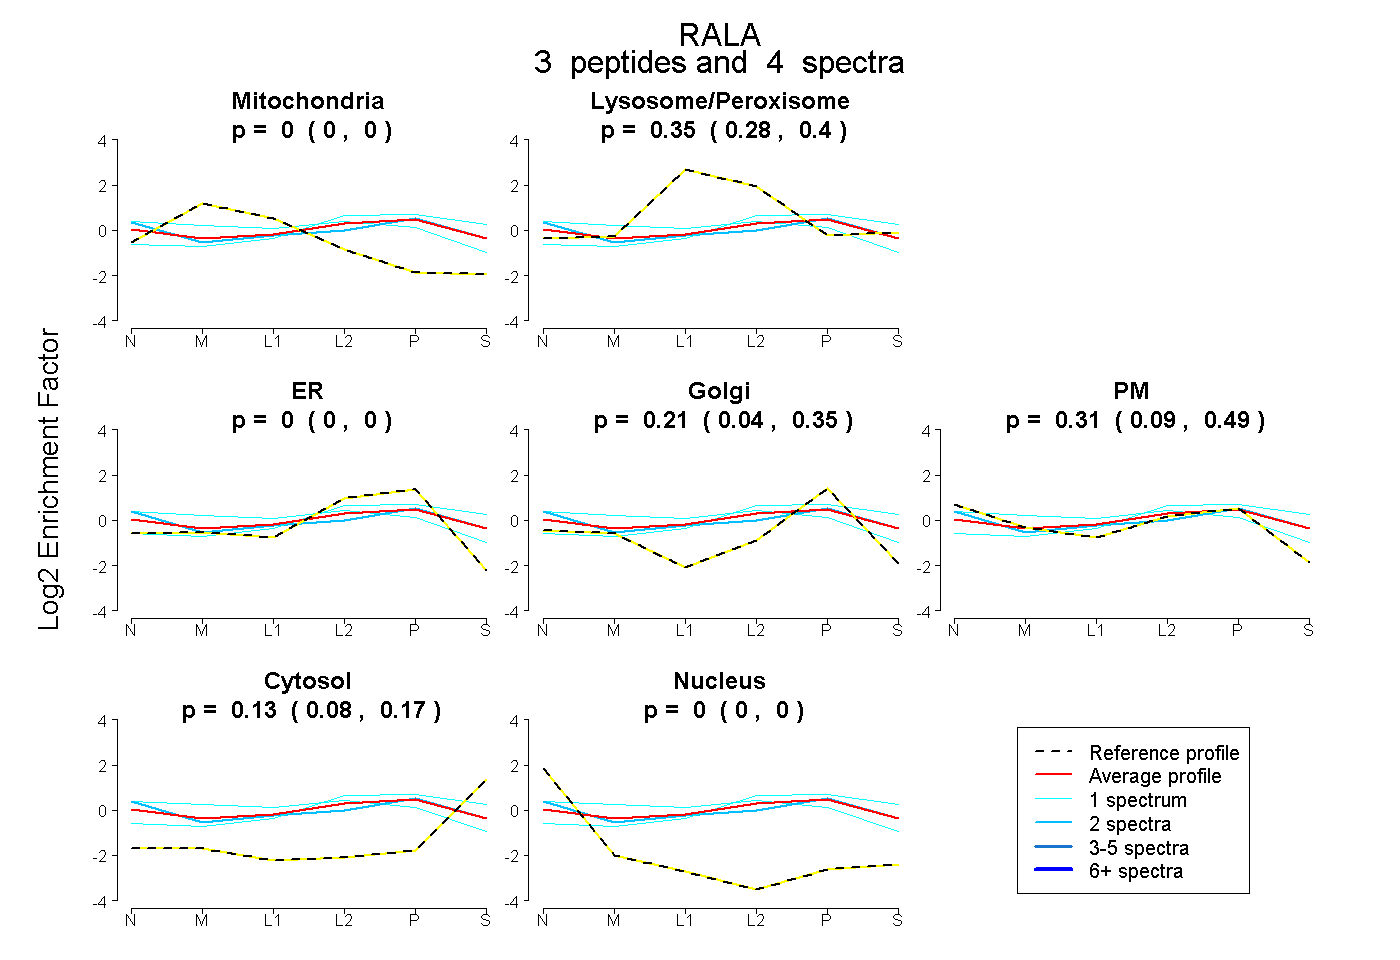
0.000 | 0.000
0.276 | 0.402
0.000 | 0.000
0.041 | 0.345
0.092 | 0.494
0.084 | 0.173
0.000 | 0.000
3peptides
spectra
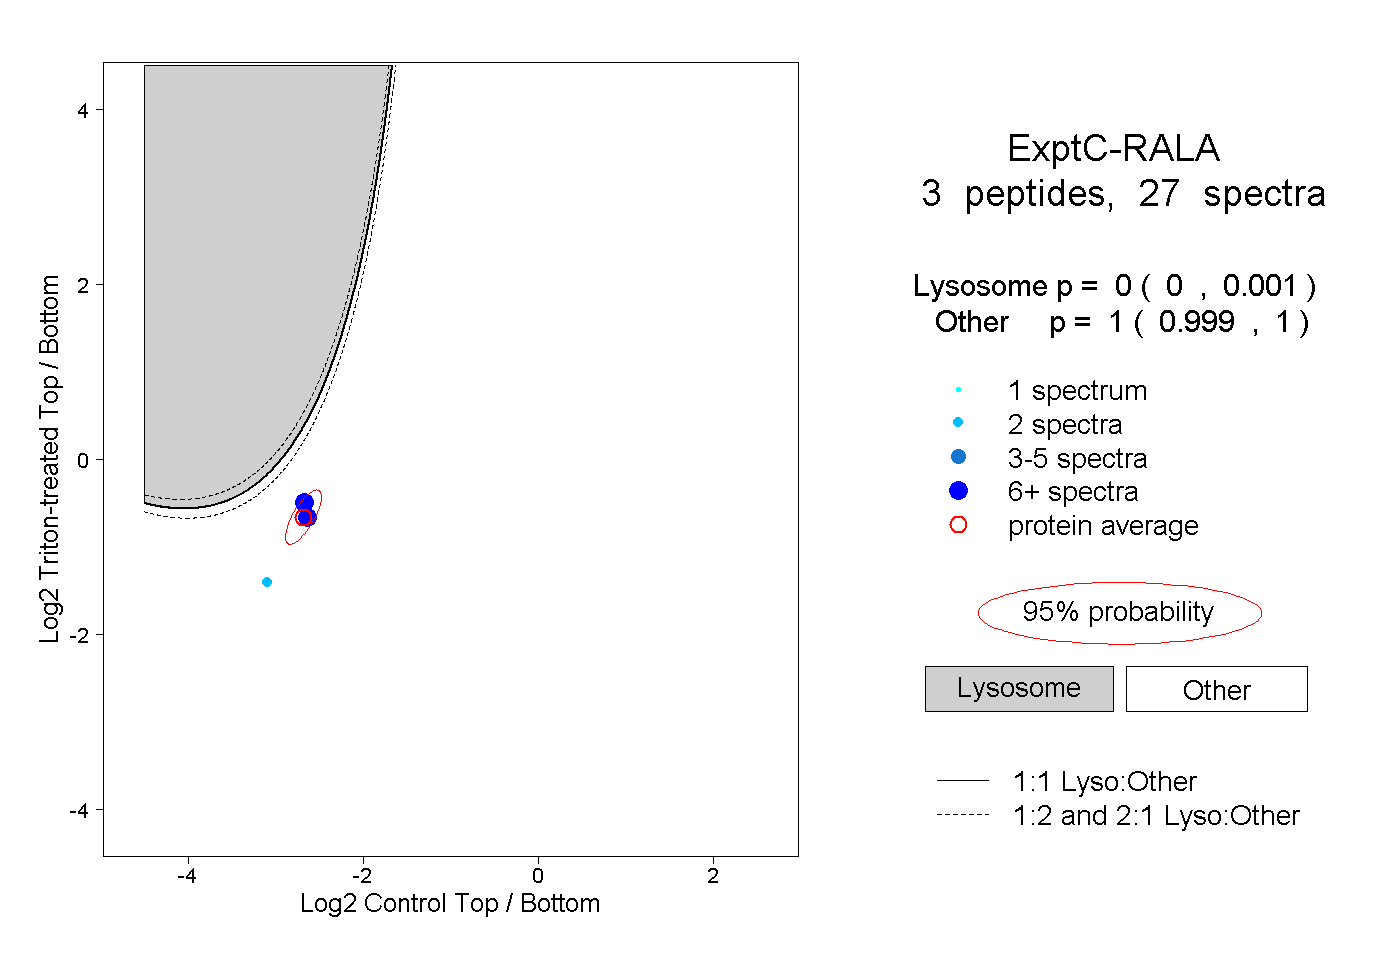
0.000 | 0.001
0.999 | 1.000