12
12peptides
spectra
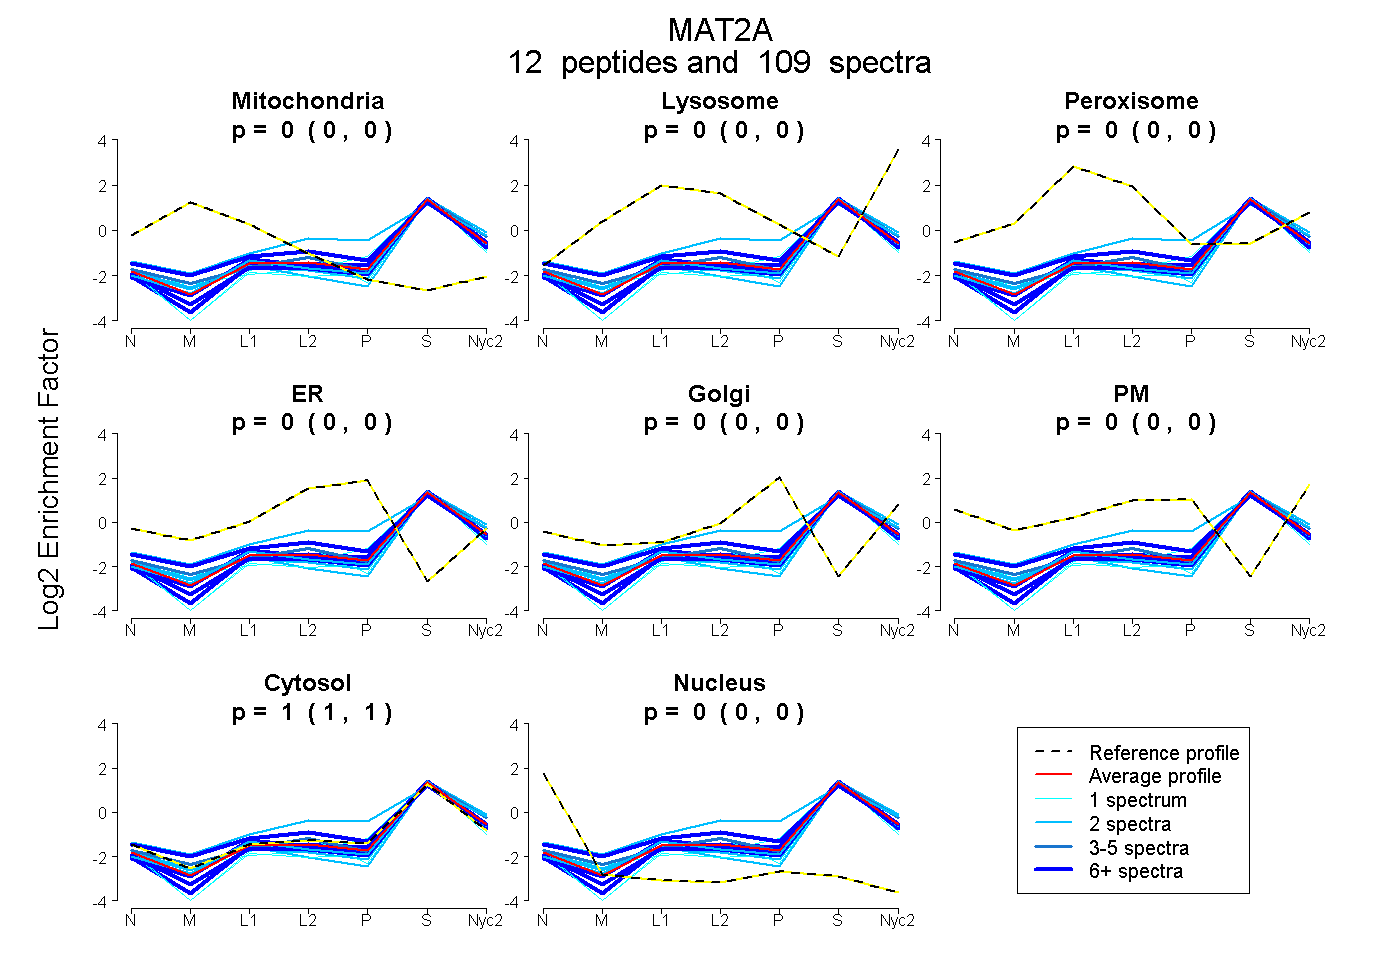
0.000 | 0.000
0.000 | 0.000
0.000 | 0.000
0.000 | 0.000
0.000 | 0.000
0.000 | 0.000
1.000 | 1.000
0.000 | 0.000
4peptides
spectra
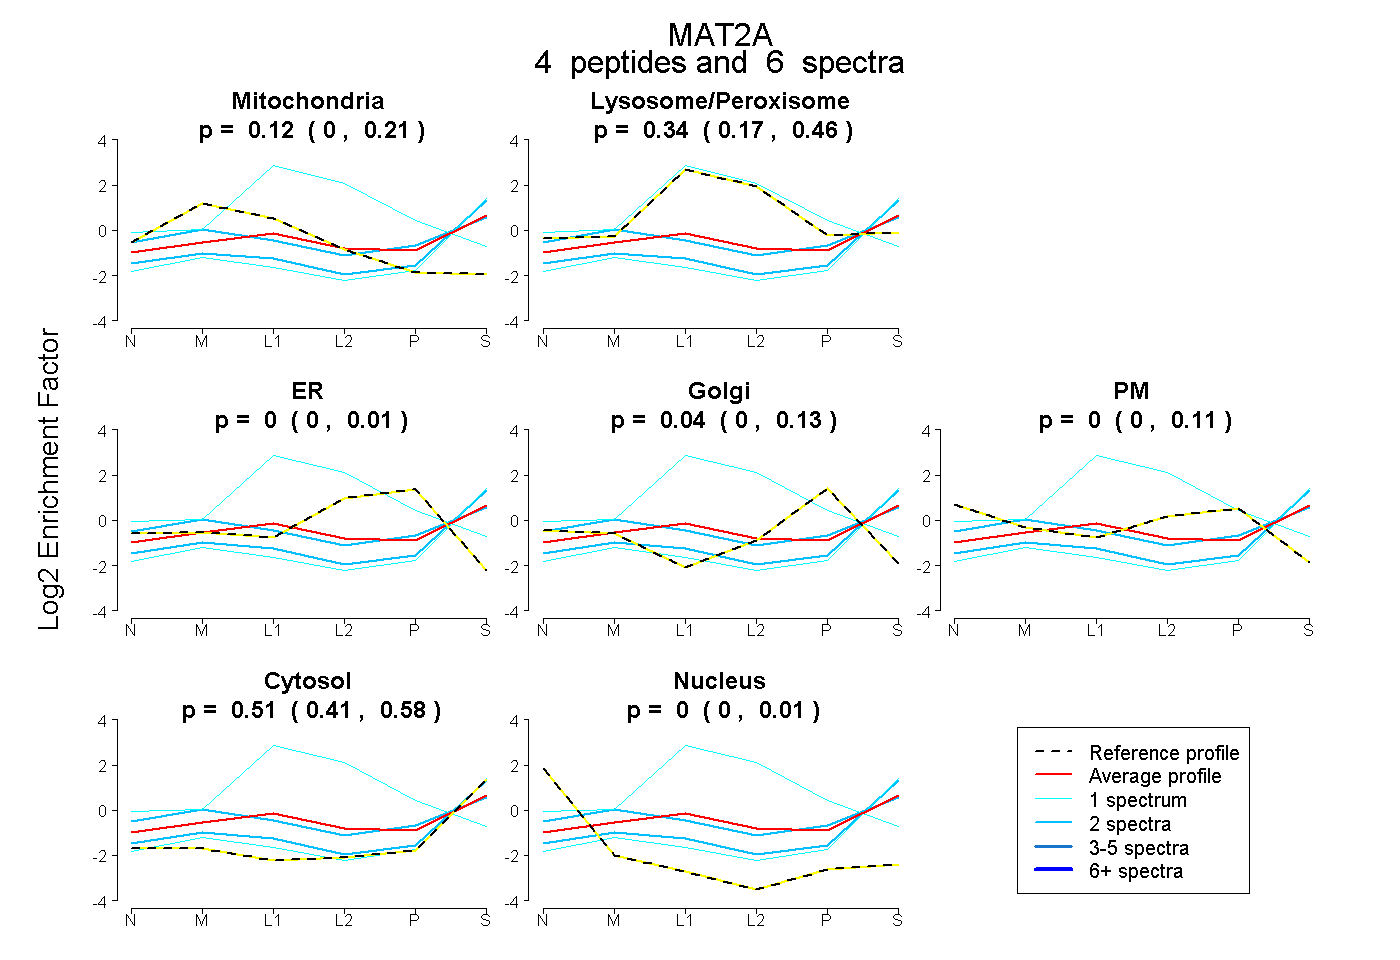
0.000 | 0.211
0.172 | 0.463
0.000 | 0.008
0.000 | 0.130
0.000 | 0.110
0.407 | 0.584
0.000 | 0.009