 12
12peptides
spectra
0.000 | 0.000
0.000 | 0.000
0.000 | 0.000
0.000 | 0.000
0.000 | 0.000
0.000 | 0.000
1.000 | 1.000
0.000 | 0.000
| Plot | Mito | Lyso | Perox | ER | Golgi | PM | Cytosol | Nucleus | |||||
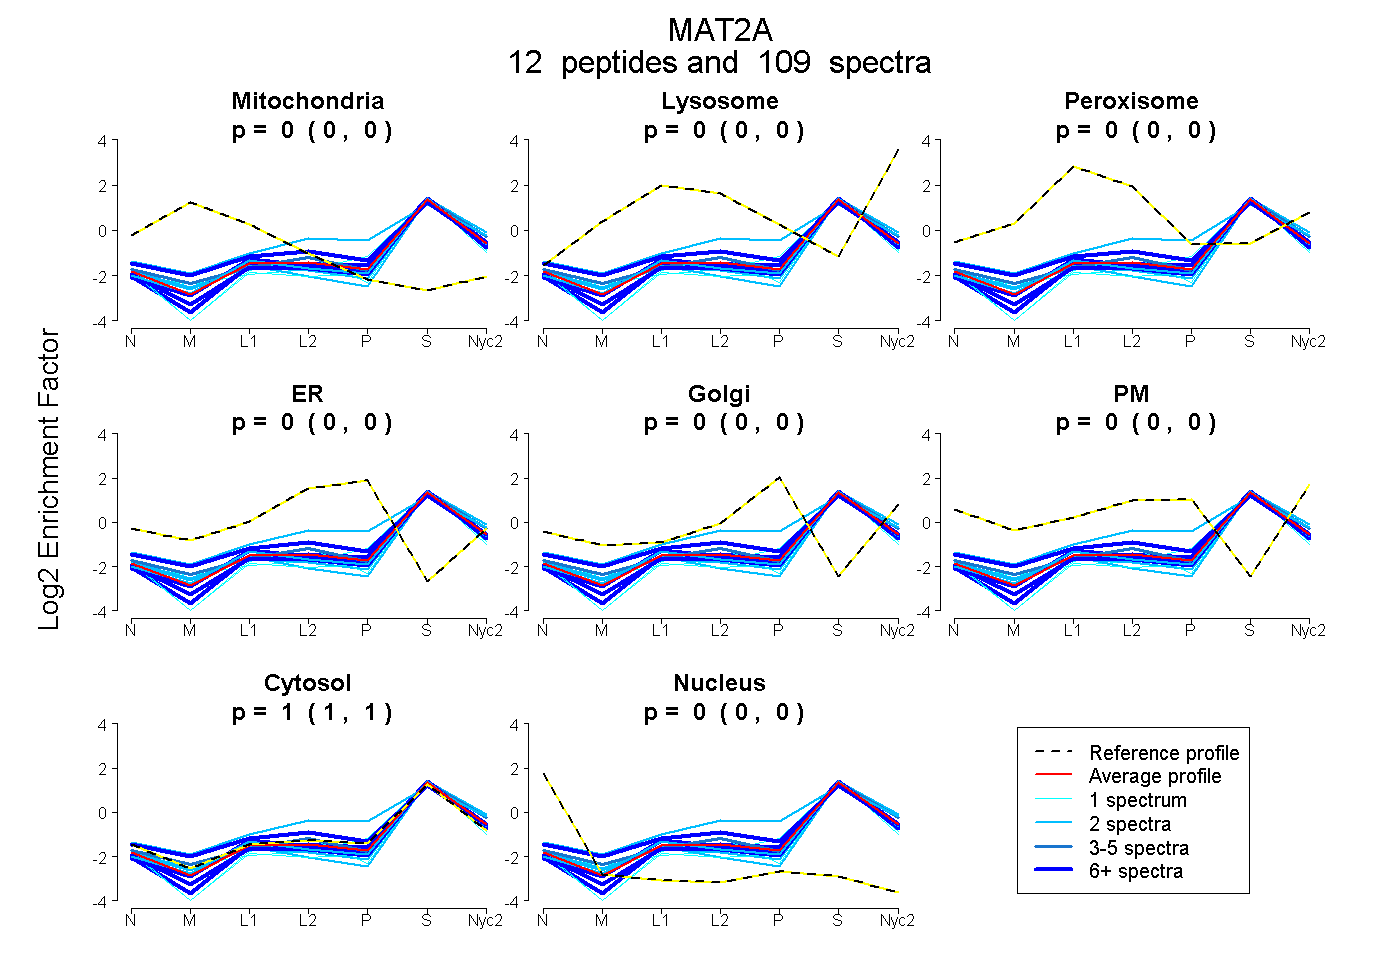
| Expt A |
12 peptides |
109 spectra |
|
0.000 0.000 | 0.000 |
0.000 0.000 | 0.000 |
0.000 0.000 | 0.000 |
0.000 0.000 | 0.000 |
0.000 0.000 | 0.000 |
0.000 0.000 | 0.000 |
1.000 1.000 | 1.000 |
0.000 0.000 | 0.000 |
| 50 spectra, SAAYAAR | 0.000 | 0.000 | 0.000 | 0.000 | 0.000 | 0.000 | 1.000 | 0.000 | ||
| 2 spectra, FVIGGPQGDAGLTGR | 0.000 | 0.000 | 0.000 | 0.000 | 0.000 | 0.000 | 1.000 | 0.000 | ||
| 1 spectrum, KPLYQR | 0.000 | 0.000 | 0.000 | 0.000 | 0.000 | 0.000 | 0.958 | 0.042 | ||
| 2 spectra, TGMILLAGEITSR | 0.000 | 0.132 | 0.000 | 0.088 | 0.000 | 0.000 | 0.780 | 0.000 | ||
| 1 spectrum, HIGYDDSSK | 0.000 | 0.000 | 0.000 | 0.000 | 0.000 | 0.000 | 1.000 | 0.000 | ||
| 8 spectra, IIVDTYGGWGAHGGGAFSGK | 0.000 | 0.000 | 0.000 | 0.000 | 0.000 | 0.000 | 1.000 | 0.000 | ||
| 4 spectra, NNFDLRPGVIVR | 0.000 | 0.033 | 0.000 | 0.000 | 0.000 | 0.000 | 0.967 | 0.000 | ||
| 1 spectrum, DSFPWEVPK | 0.000 | 0.000 | 0.000 | 0.000 | 0.000 | 0.000 | 1.000 | 0.000 | ||
| 15 spectra, AVVPAK | 0.000 | 0.000 | 0.000 | 0.000 | 0.000 | 0.000 | 1.000 | 0.000 | ||
| 2 spectra, GAVIPIR | 0.000 | 0.000 | 0.000 | 0.000 | 0.000 | 0.000 | 1.000 | 0.000 | ||
| 2 spectra, TQVTVQYMQDR | 0.000 | 0.000 | 0.000 | 0.000 | 0.000 | 0.000 | 1.000 | 0.000 | ||
| 21 spectra, YLDEDTIYHLQPSGR | 0.001 | 0.047 | 0.051 | 0.000 | 0.000 | 0.000 | 0.902 | 0.000 |
| Plot | Mito | Lyso or Perox | ER | Golgi | PM | Cytosol | Nucleus | ||||||
| Expt B |
4 peptides |
6 spectra |
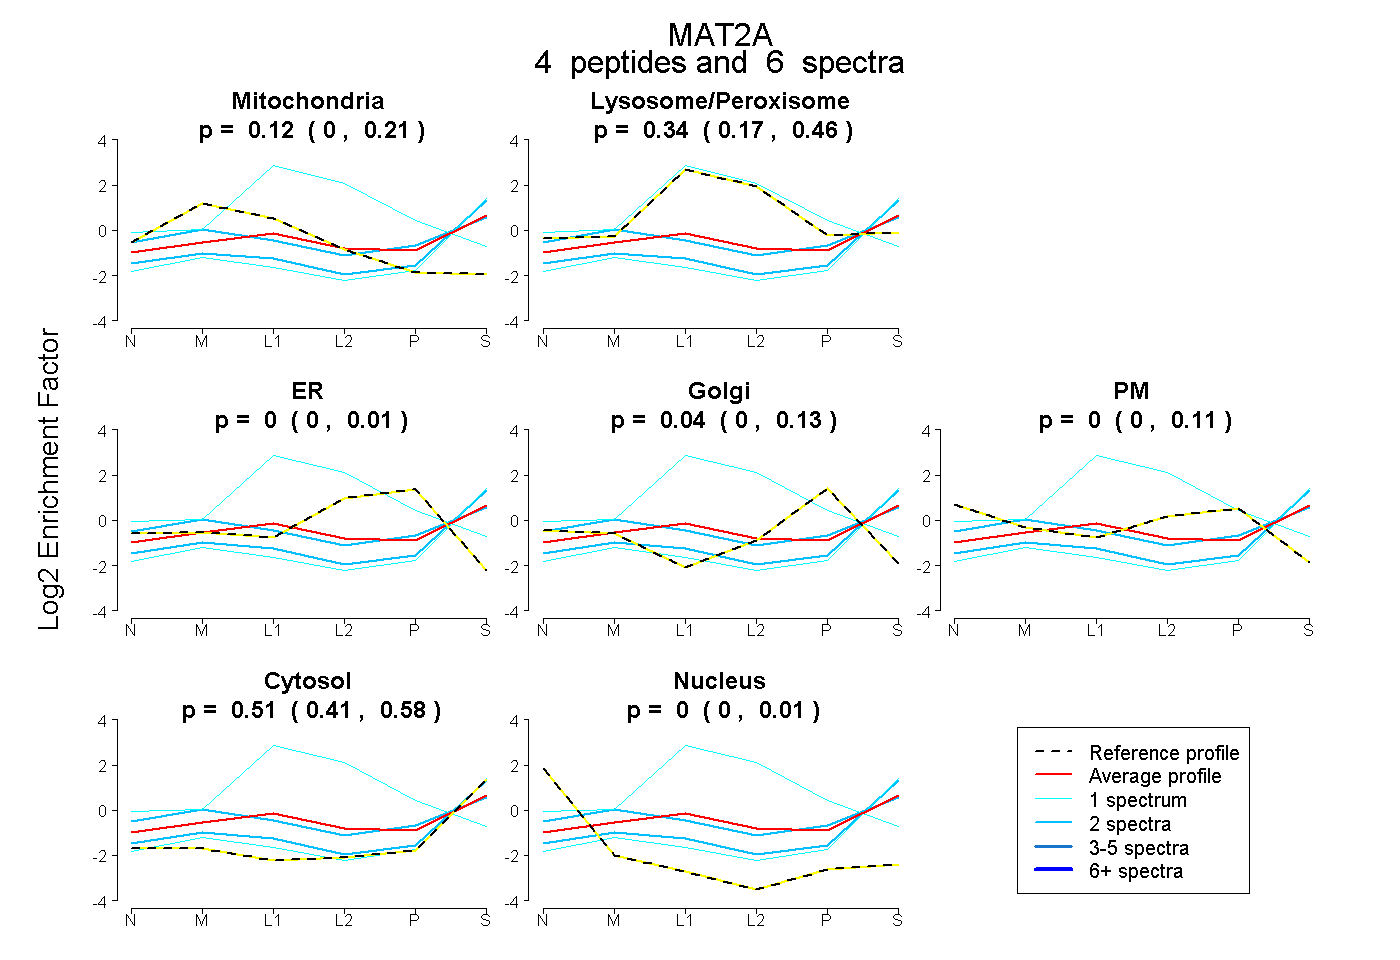 |
0.115 0.000 | 0.211 |
0.337 0.172 | 0.463 |
0.000 0.000 | 0.008 |
0.039 0.000 | 0.130 |
0.000 0.000 | 0.110 |
0.509 0.407 | 0.584 |
0.000 0.000 | 0.009 |
|||
| Plot | Lyso | Other | |||||||||||
| Expt C |
5 peptides |
21 spectra |
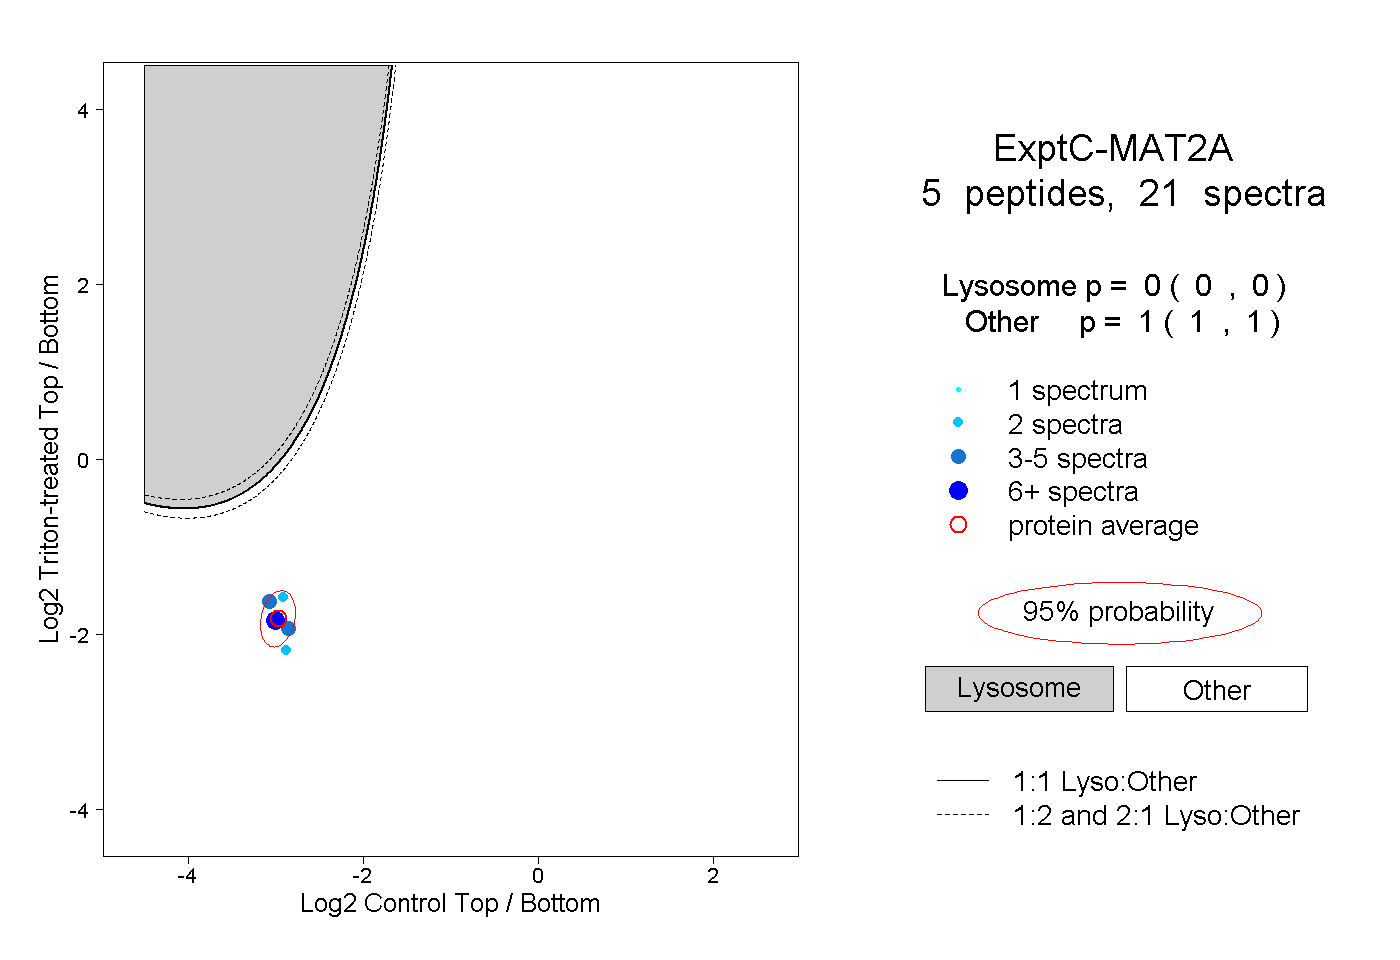 |
0.000 0.000 | 0.000 |
1.000 1.000 | 1.000 |