 11
11peptides
spectra
0.000 | 0.000
0.000 | 0.000
0.000 | 0.000
0.000 | 0.000
0.000 | 0.000
0.000 | 0.000
0.861 | 0.870
0.128 | 0.139
| Plot | Mito | Lyso | Perox | ER | Golgi | PM | Cytosol | Nucleus | |||||
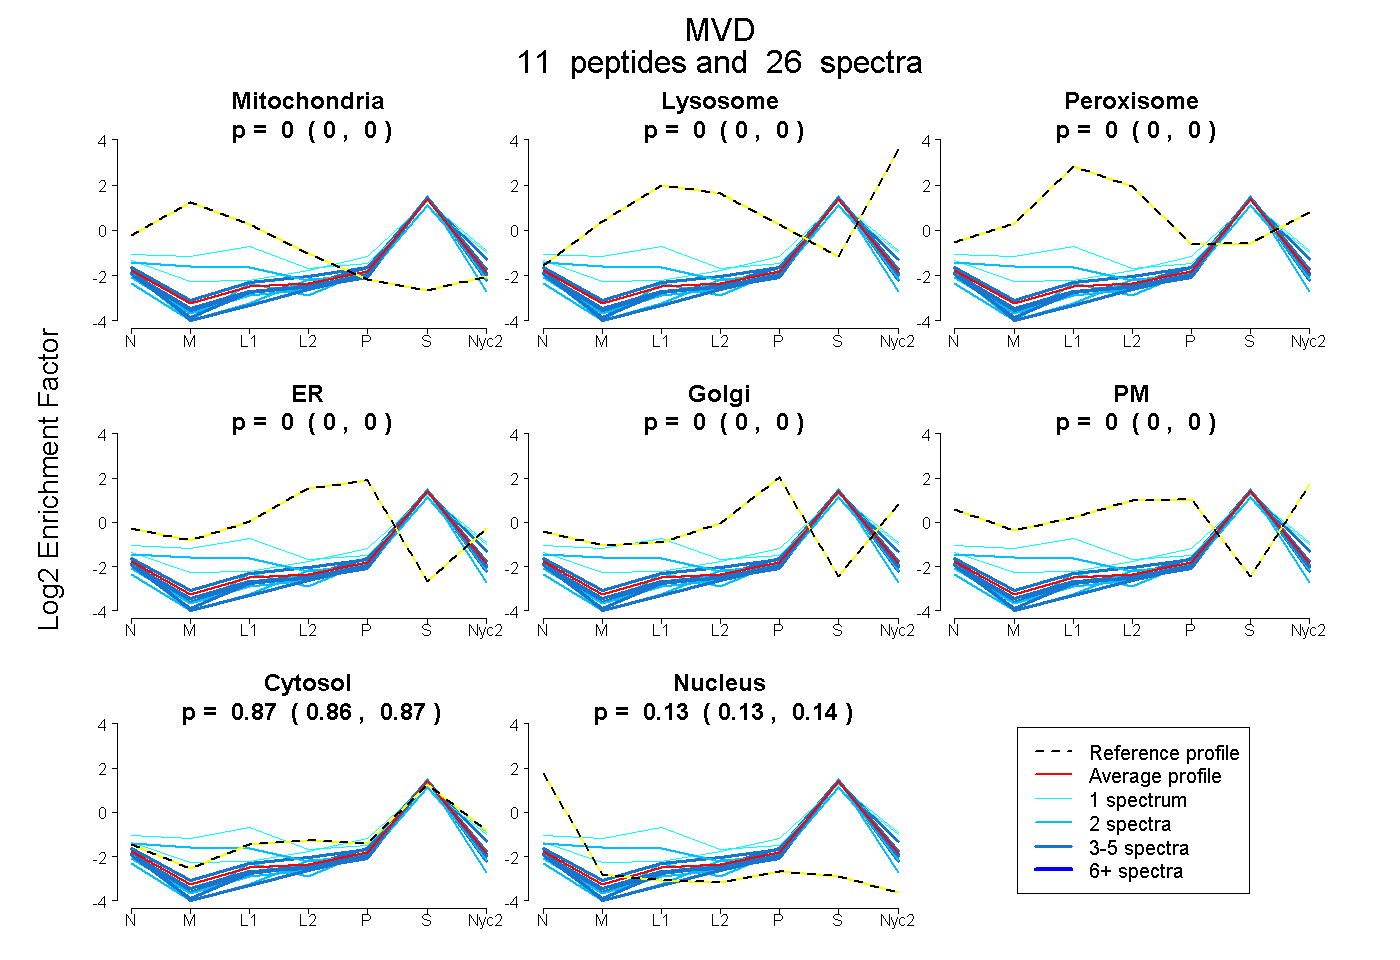
| Expt A |
11 peptides |
26 spectra |
|
0.000 0.000 | 0.000 |
0.000 0.000 | 0.000 |
0.000 0.000 | 0.000 |
0.000 0.000 | 0.000 |
0.000 0.000 | 0.000 |
0.000 0.000 | 0.000 |
0.866 0.861 | 0.870 |
0.134 0.128 | 0.139 |
| 3 spectra, FNAHHGQTK | 0.000 | 0.000 | 0.000 | 0.000 | 0.000 | 0.000 | 0.866 | 0.134 | ||
| 2 spectra, QIAPEWHWPQLR | 0.000 | 0.000 | 0.000 | 0.000 | 0.000 | 0.000 | 0.832 | 0.168 | ||
| 3 spectra, VYGVEGDLSEVAR | 0.000 | 0.000 | 0.000 | 0.000 | 0.000 | 0.000 | 0.854 | 0.146 | ||
| 2 spectra, TTTTAAISK | 0.093 | 0.000 | 0.000 | 0.000 | 0.000 | 0.000 | 0.808 | 0.099 | ||
| 4 spectra, IIQLVHR | 0.000 | 0.000 | 0.000 | 0.000 | 0.000 | 0.000 | 0.918 | 0.082 | ||
| 3 spectra, VLILVVSAEK | 0.000 | 0.000 | 0.000 | 0.000 | 0.000 | 0.000 | 0.821 | 0.179 | ||
| 2 spectra, AESIVPER | 0.000 | 0.000 | 0.000 | 0.000 | 0.000 | 0.000 | 0.884 | 0.116 | ||
| 3 spectra, EEDVGQPR | 0.000 | 0.000 | 0.000 | 0.000 | 0.000 | 0.000 | 0.832 | 0.168 | ||
| 1 spectrum, STGDGDALPLSLGYK | 0.190 | 0.000 | 0.031 | 0.000 | 0.000 | 0.000 | 0.779 | 0.000 | ||
| 1 spectrum, IWLNGR | 0.000 | 0.000 | 0.000 | 0.000 | 0.000 | 0.000 | 0.947 | 0.053 | ||
| 2 spectra, LQACLR | 0.000 | 0.000 | 0.000 | 0.000 | 0.000 | 0.000 | 0.811 | 0.189 |
| Plot | Mito | Lyso or Perox | ER | Golgi | PM | Cytosol | Nucleus | ||||||
| Expt B |
2 peptides |
7 spectra |
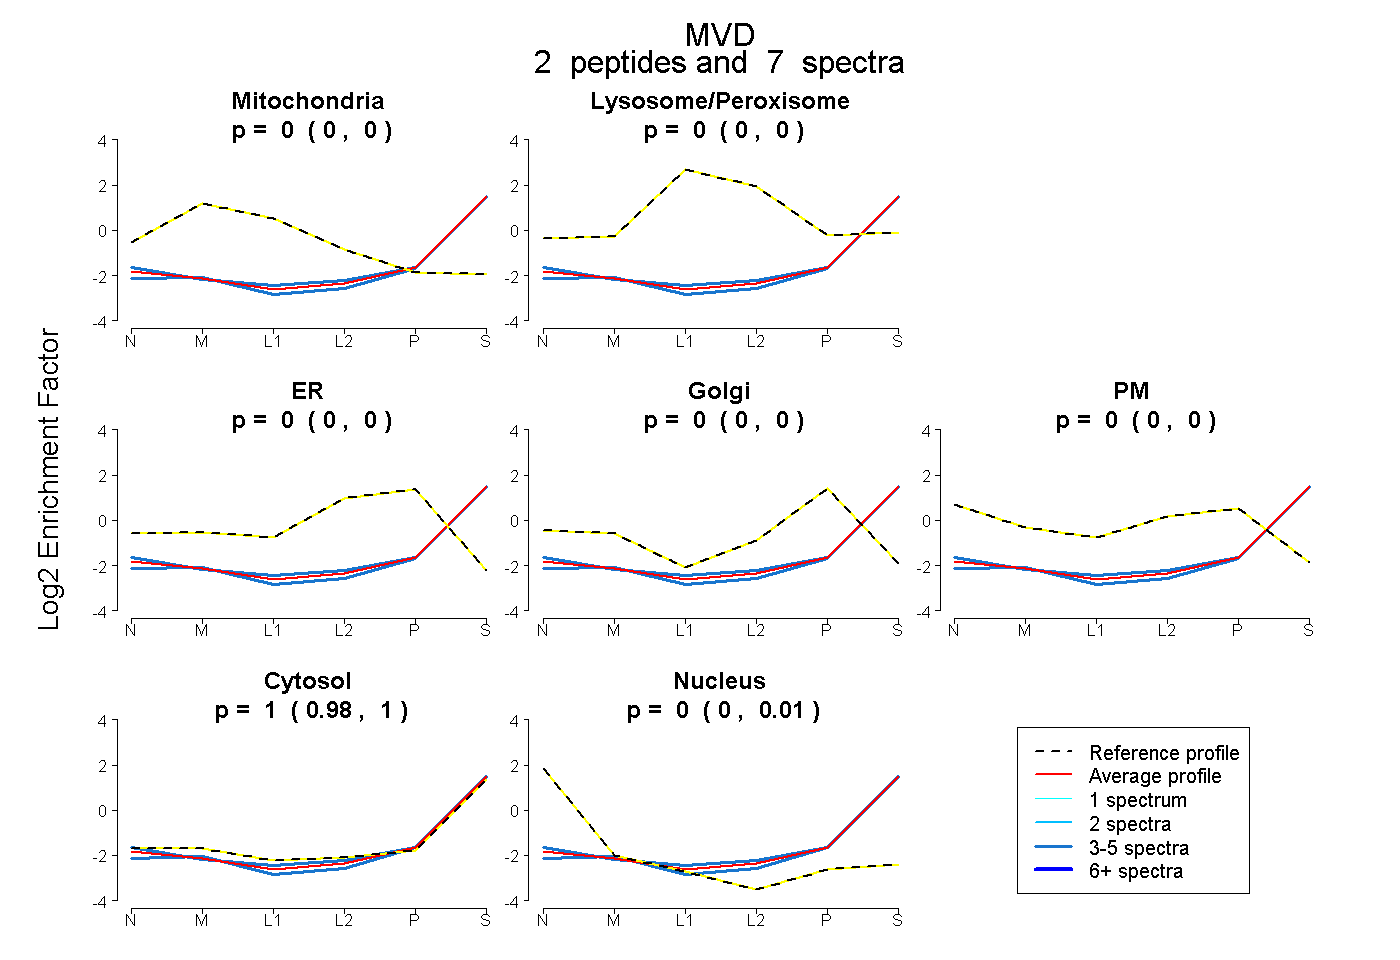 |
0.000 0.000 | 0.000 |
0.000 0.000 | 0.000 |
0.000 0.000 | 0.000 |
0.000 0.000 | 0.000 |
0.000 0.000 | 0.000 |
1.000 0.980 | 1.000 |
0.000 0.000 | 0.014 |
|||
| Plot | Lyso | Other | |||||||||||
| Expt C |
5 peptides |
13 spectra |
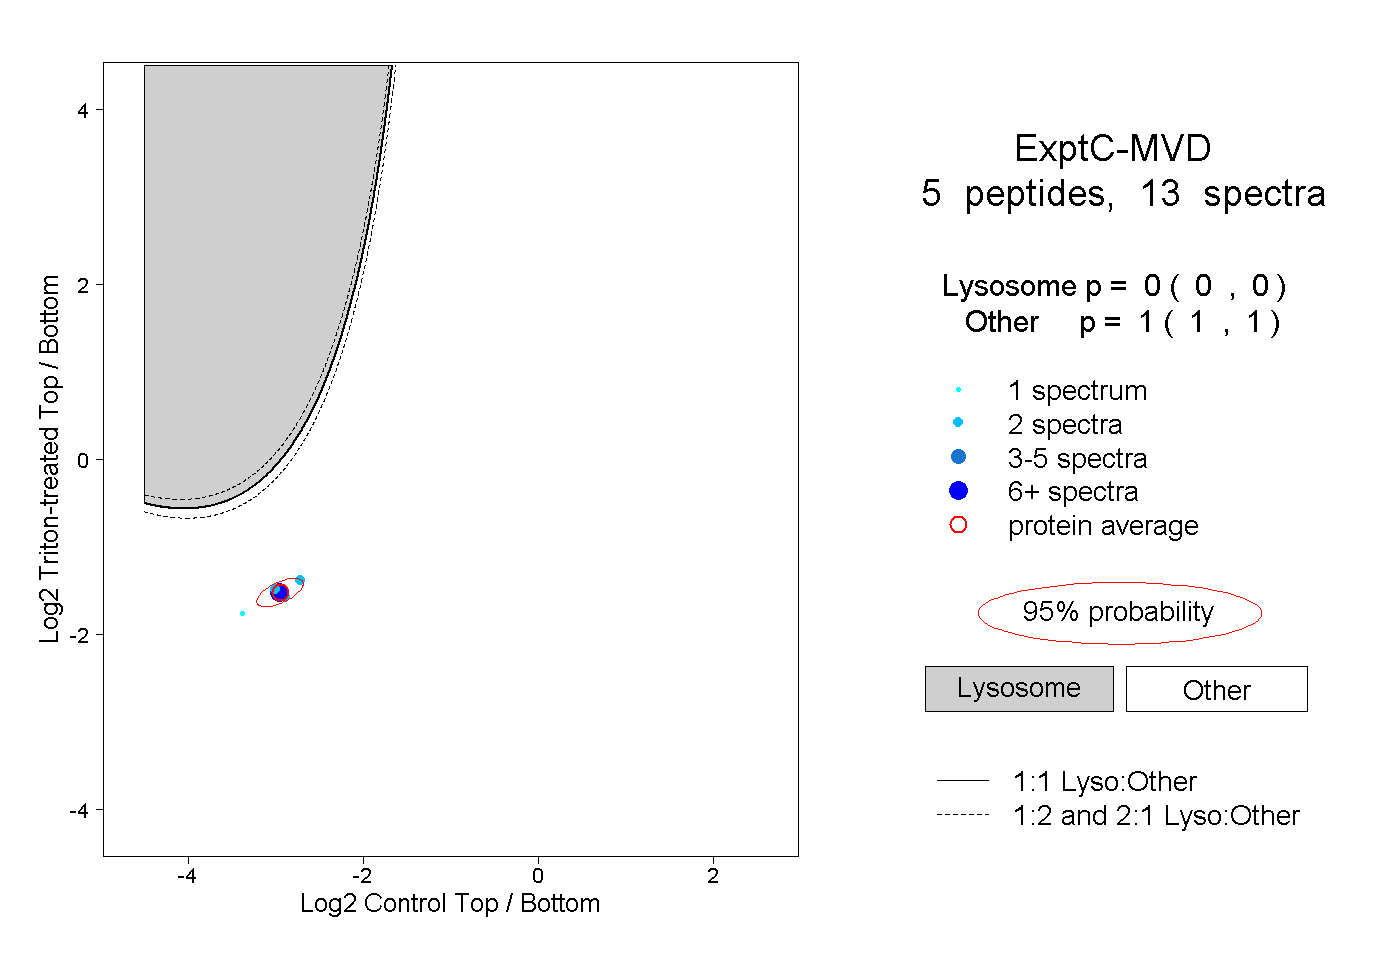 |
0.000 0.000 | 0.000 |
1.000 1.000 | 1.000 |