 8
8peptides
spectra
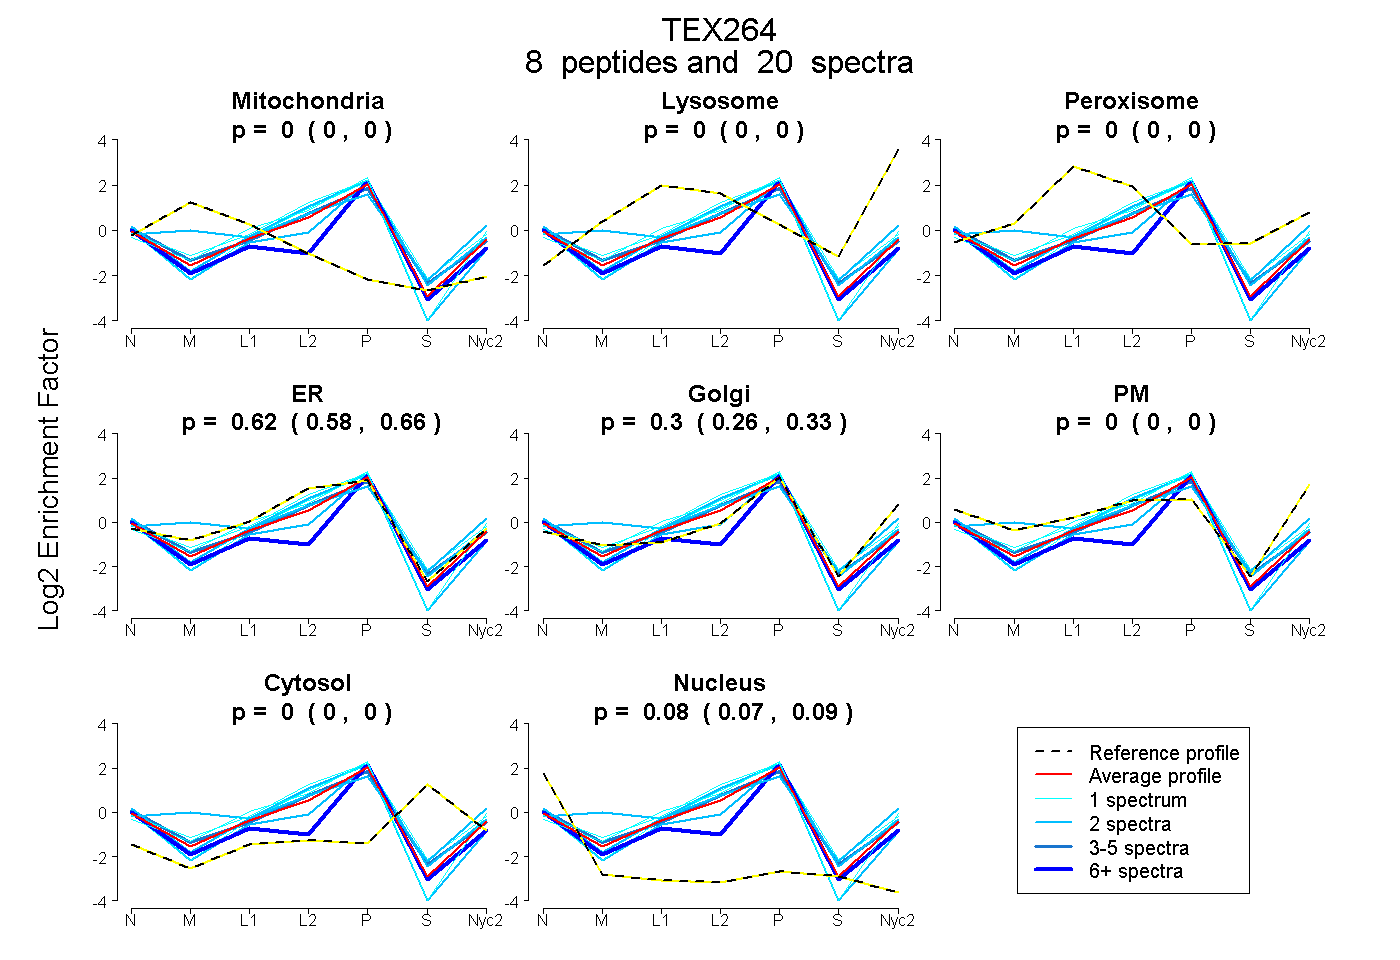
0.000 | 0.000
0.000 | 0.000
0.000 | 0.000
0.577 | 0.656
0.255 | 0.331
0.000 | 0.000
0.000 | 0.000
0.073 | 0.089
2peptides
spectra
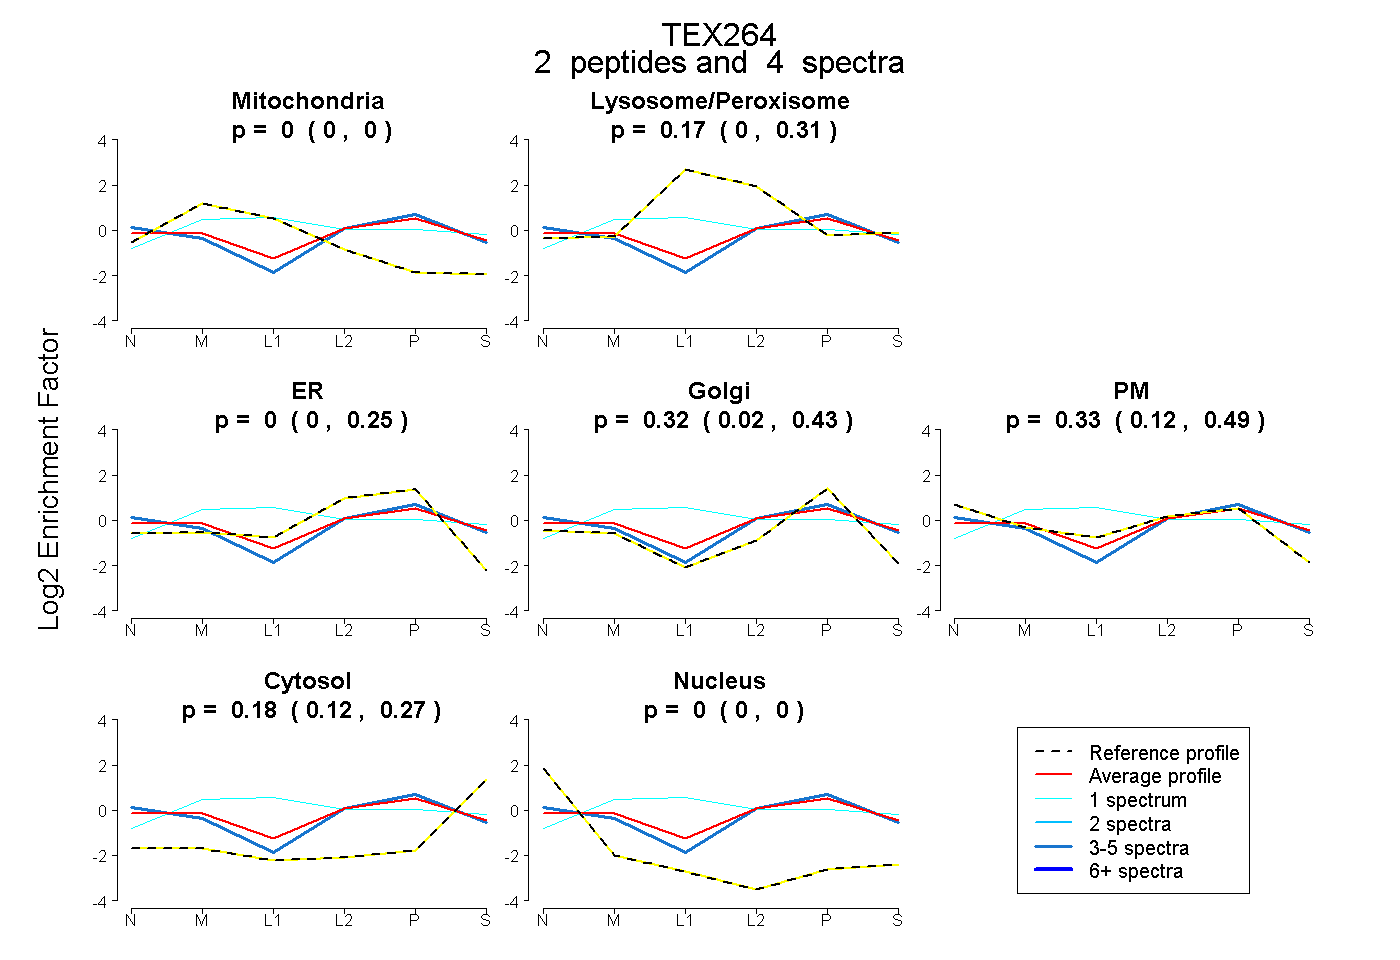
0.000 | 0.000
0.000 | 0.306
0.000 | 0.252
0.025 | 0.434
0.116 | 0.494
0.119 | 0.270
0.000 | 0.000
8peptides
spectra
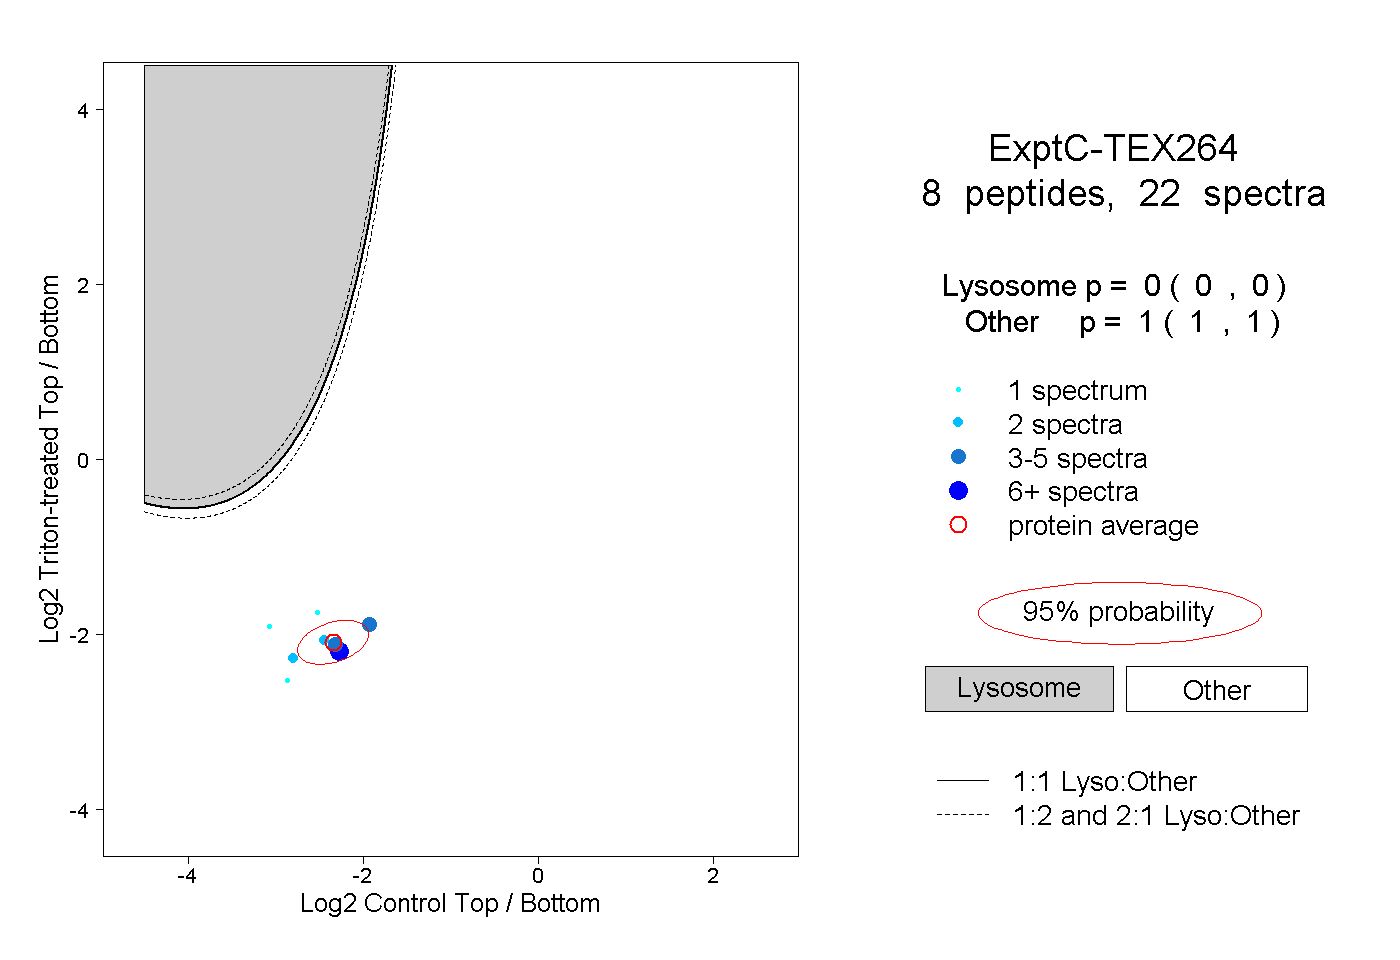
0.000 | 0.000
1.000 | 1.000
1peptide
spectrum
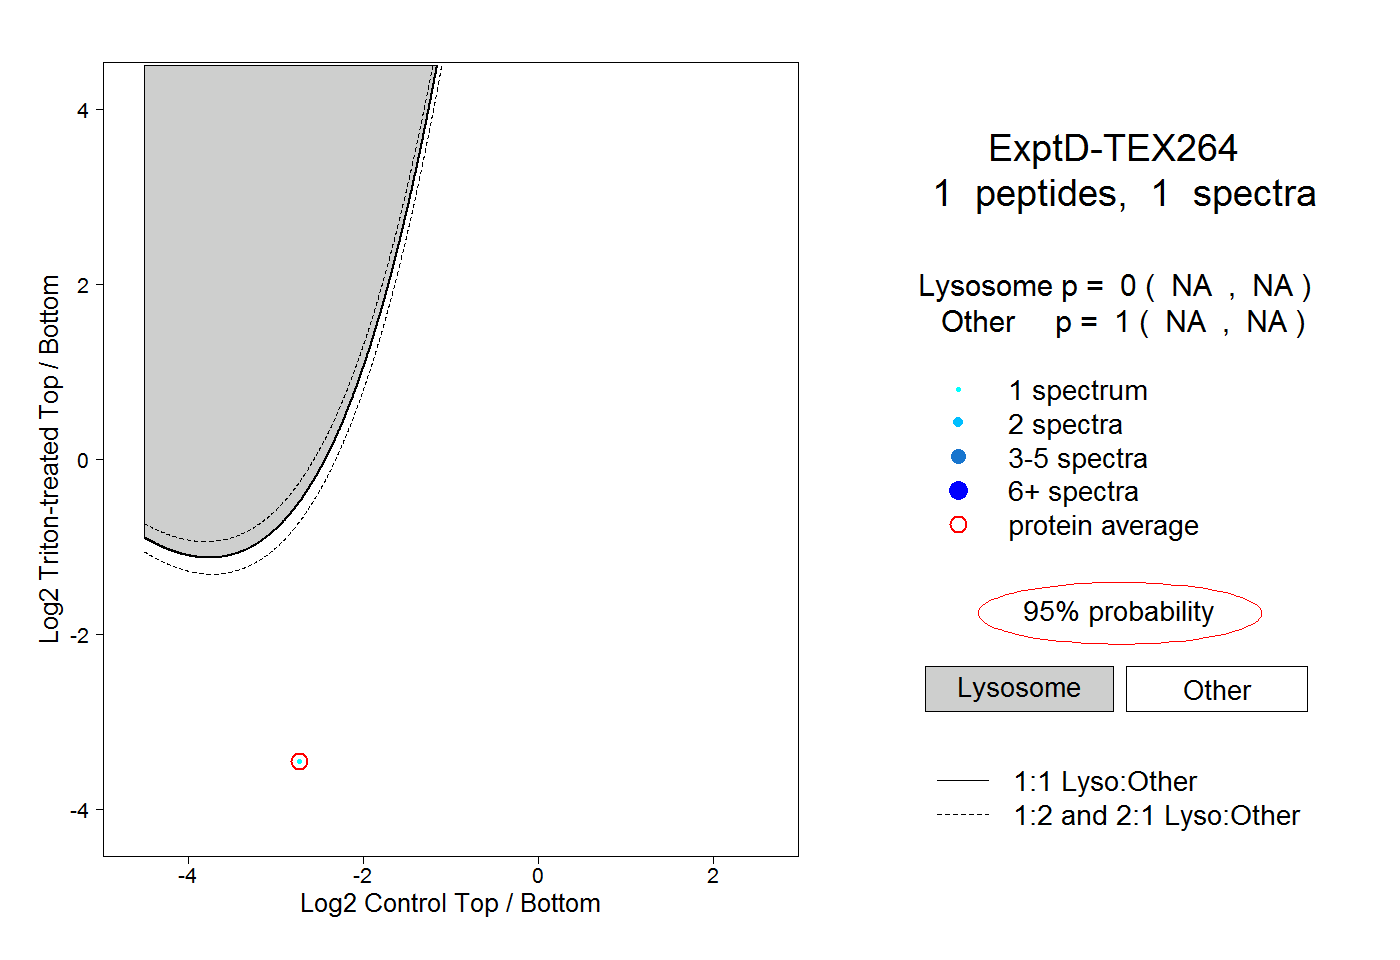
NA | NA
NA | NA