 7
7peptides
spectra
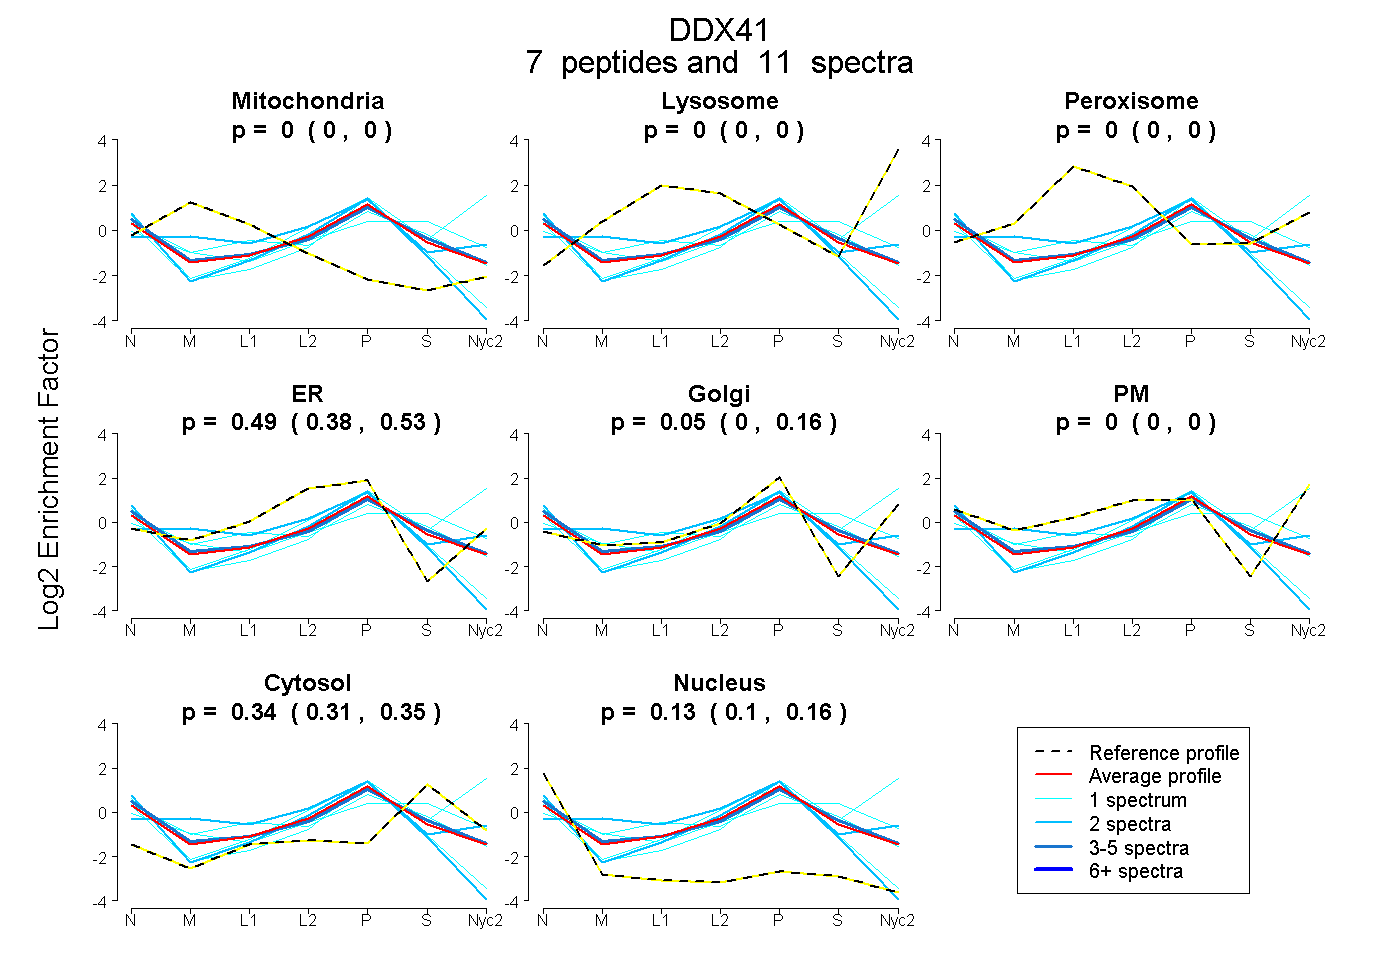
0.000 | 0.000
0.000 | 0.000
0.000 | 0.000
0.376 | 0.530
0.000 | 0.163
0.000 | 0.000
0.306 | 0.353
0.099 | 0.159
| Plot | Mito | Lyso | Perox | ER | Golgi | PM | Cytosol | Nucleus | |||||
| Expt A |
7 peptides |
11 spectra |
|
0.000 0.000 | 0.000 |
0.000 0.000 | 0.000 |
0.000 0.000 | 0.000 |
0.486 0.376 | 0.530 |
0.049 0.000 | 0.163 |
0.000 0.000 | 0.000 |
0.335 0.306 | 0.353 |
0.131 0.099 | 0.159 |
| 2 spectra, SALVKPVTINVGR | 0.000 | 0.000 | 0.000 | 0.507 | 0.000 | 0.000 | 0.105 | 0.388 | ||
| 2 spectra, TPPPVLIFAEK | 0.096 | 0.000 | 0.016 | 0.428 | 0.242 | 0.000 | 0.217 | 0.000 | ||
| 1 spectrum, LLQEDSSPLLR | 0.030 | 0.000 | 0.000 | 0.186 | 0.152 | 0.062 | 0.558 | 0.013 | ||
| 3 spectra, YLALDEADR | 0.000 | 0.000 | 0.000 | 0.452 | 0.057 | 0.000 | 0.357 | 0.134 | ||
| 1 spectrum, ACDESVLMDLK | 0.000 | 0.000 | 0.000 | 0.000 | 0.656 | 0.020 | 0.324 | 0.000 | ||
| 1 spectrum, DMIGIAFTGSGK | 0.054 | 0.000 | 0.020 | 0.438 | 0.000 | 0.000 | 0.392 | 0.096 | ||
| 1 spectrum, LPAALLR | 0.000 | 0.000 | 0.000 | 0.545 | 0.000 | 0.000 | 0.142 | 0.313 |
| Plot | Lyso | Other | |||||||||||
| Expt C |
3 peptides |
3 spectra |
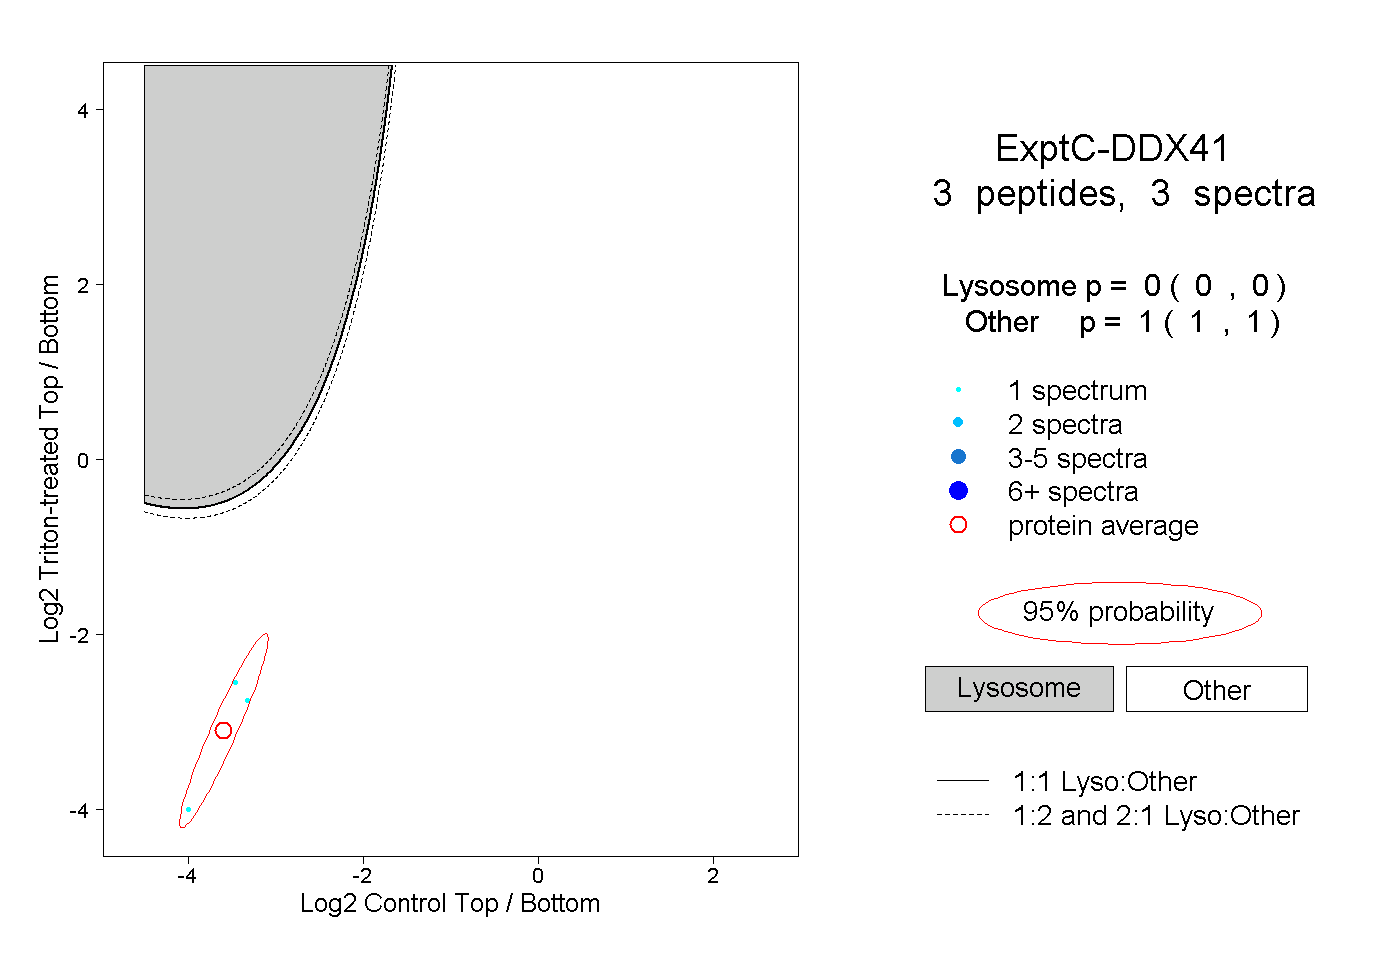 |
0.000 0.000 | 0.000 |
1.000 1.000 | 1.000 |