 1
1peptide
spectra
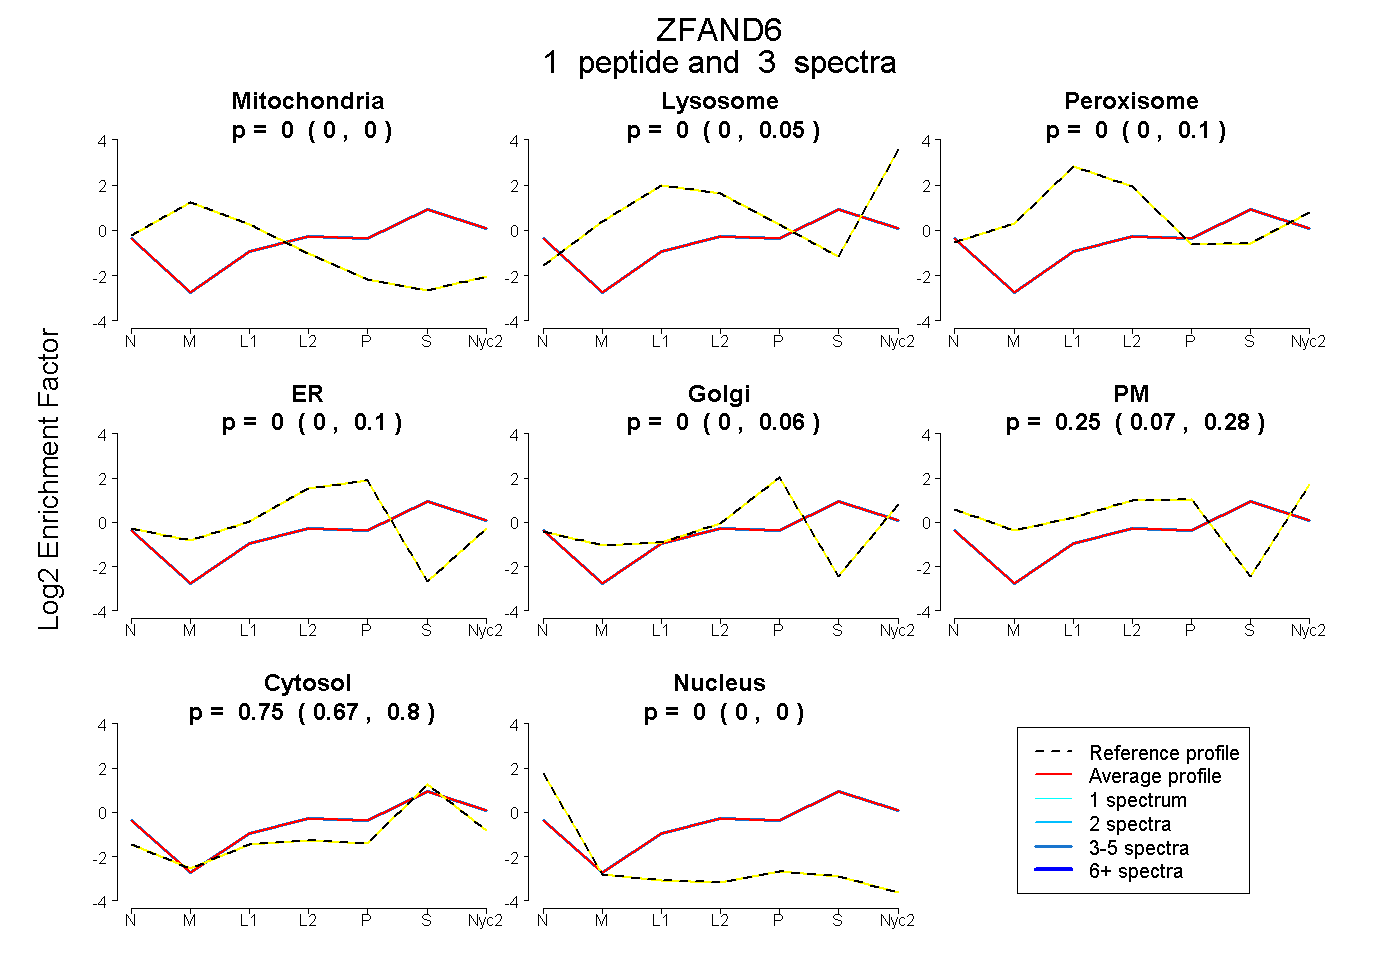
0.000 | 0.000
0.000 | 0.052
0.000 | 0.099
0.000 | 0.104
0.000 | 0.057
0.071 | 0.283
0.666 | 0.800
0.000 | 0.000
1peptide
spectra
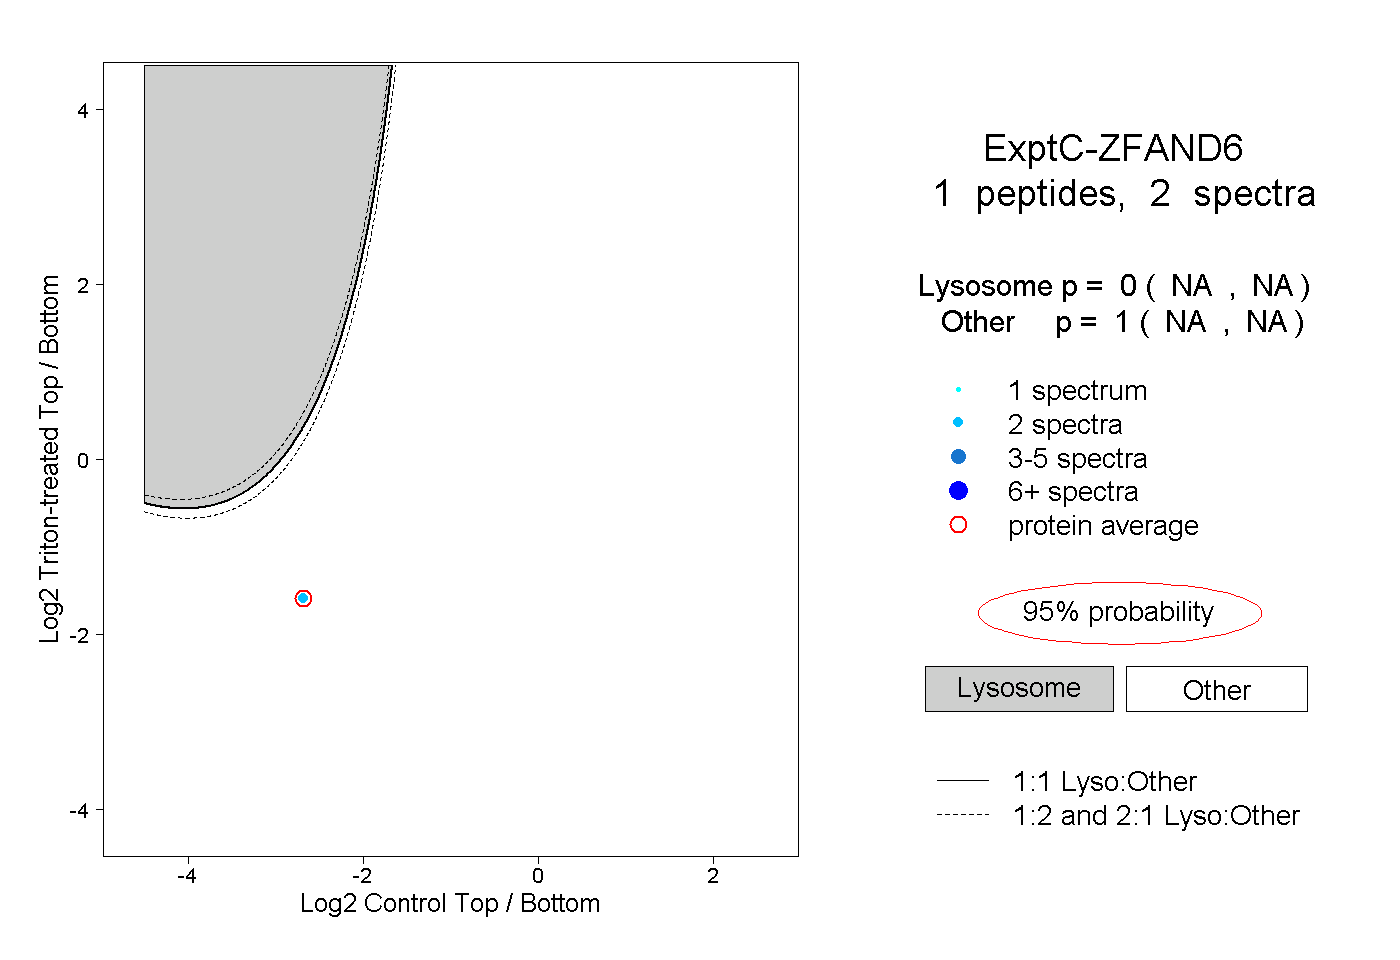
NA | NA
NA | NA
1peptide
spectra
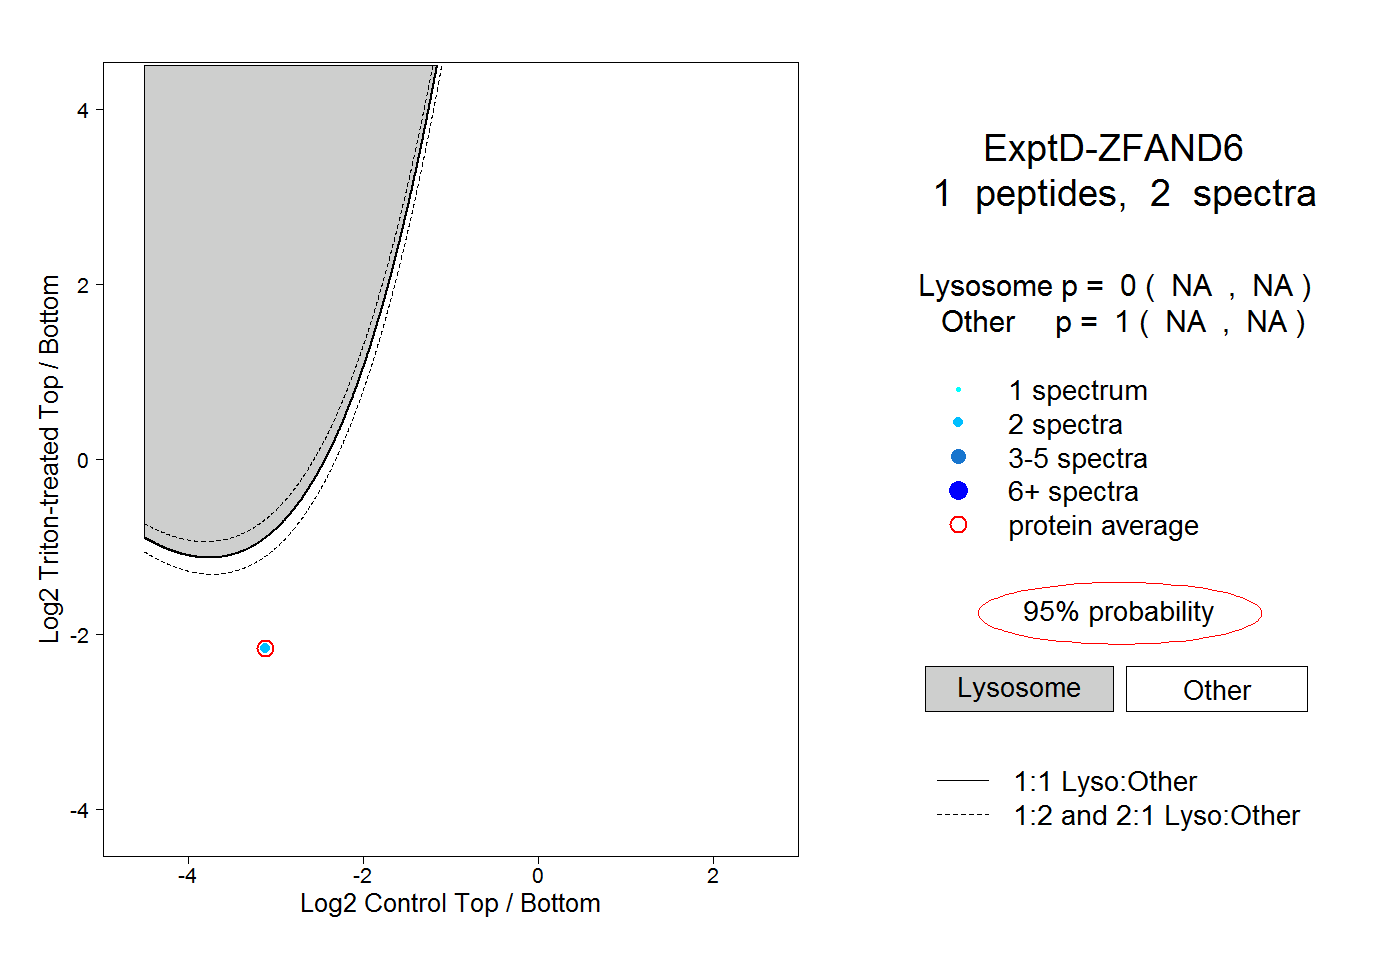
NA | NA
NA | NA