 10
10peptides
spectra
0.000 | 0.000
0.000 | 0.000
0.000 | 0.000
0.000 | 0.009
0.047 | 0.096
0.275 | 0.329
0.464 | 0.479
0.137 | 0.155
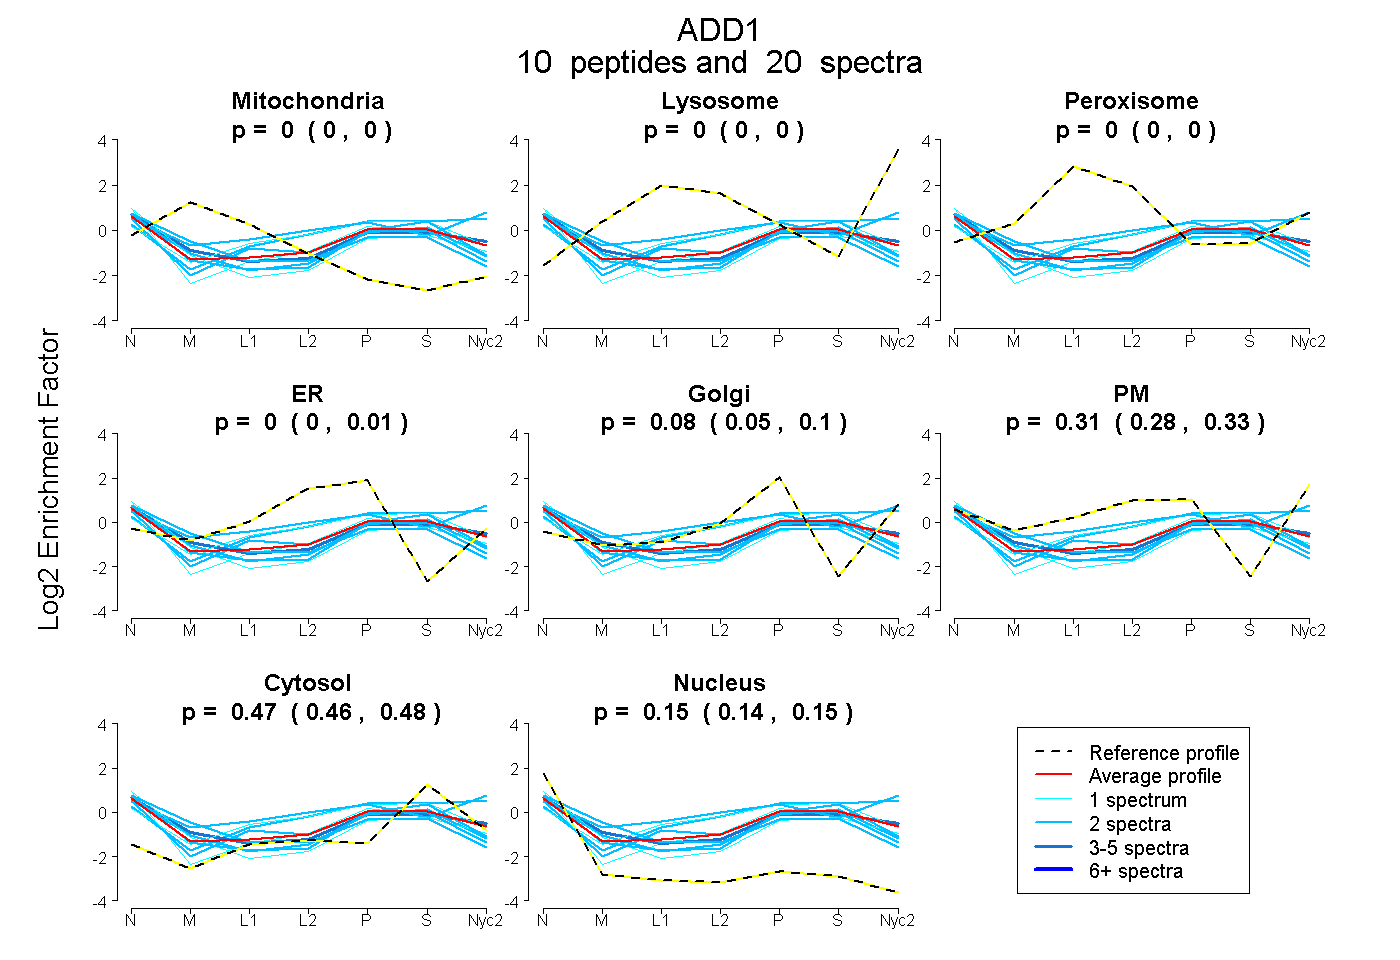
| Plot | Mito | Lyso | Perox | ER | Golgi | PM | Cytosol | Nucleus | |||||
| Expt A |
10 peptides |
20 spectra |
|
0.000 0.000 | 0.000 |
0.000 0.000 | 0.000 |
0.000 0.000 | 0.000 |
0.000 0.000 | 0.009 |
0.075 0.047 | 0.096 |
0.306 0.275 | 0.329 |
0.472 0.464 | 0.479 |
0.147 0.137 | 0.155 |
| 2 spectra, VNLQGDIVDR | 0.232 | 0.000 | 0.000 | 0.000 | 0.176 | 0.065 | 0.347 | 0.179 | ||
| 1 spectrum, TLASAGGPDNLVLLDPGK | 0.000 | 0.000 | 0.000 | 0.000 | 0.143 | 0.170 | 0.389 | 0.298 | ||
| 1 spectrum, AAVVTSPPPTTAPHK | 0.000 | 0.000 | 0.000 | 0.000 | 0.163 | 0.220 | 0.436 | 0.182 | ||
| 2 spectra, QDFNMMEQK | 0.000 | 0.000 | 0.041 | 0.000 | 0.000 | 0.582 | 0.376 | 0.000 | ||
| 1 spectrum, LEGGLPQEPTSR | 0.000 | 0.000 | 0.058 | 0.266 | 0.000 | 0.116 | 0.543 | 0.017 | ||
| 2 spectra, ELEEYR | 0.000 | 0.000 | 0.000 | 0.000 | 0.000 | 0.461 | 0.539 | 0.000 | ||
| 5 spectra, LAAFYR | 0.019 | 0.000 | 0.000 | 0.000 | 0.068 | 0.315 | 0.432 | 0.166 | ||
| 2 spectra, WQIGEQEFEALMR | 0.005 | 0.000 | 0.000 | 0.000 | 0.247 | 0.057 | 0.436 | 0.256 | ||
| 2 spectra, VDENNPEYLR | 0.000 | 0.000 | 0.024 | 0.156 | 0.000 | 0.125 | 0.557 | 0.138 | ||
| 2 spectra, MLDNLGYR | 0.052 | 0.000 | 0.000 | 0.000 | 0.237 | 0.058 | 0.466 | 0.187 |
| Plot | Mito | Lyso or Perox | ER | Golgi | PM | Cytosol | Nucleus | ||||||
| Expt B |
1 peptide |
2 spectra |
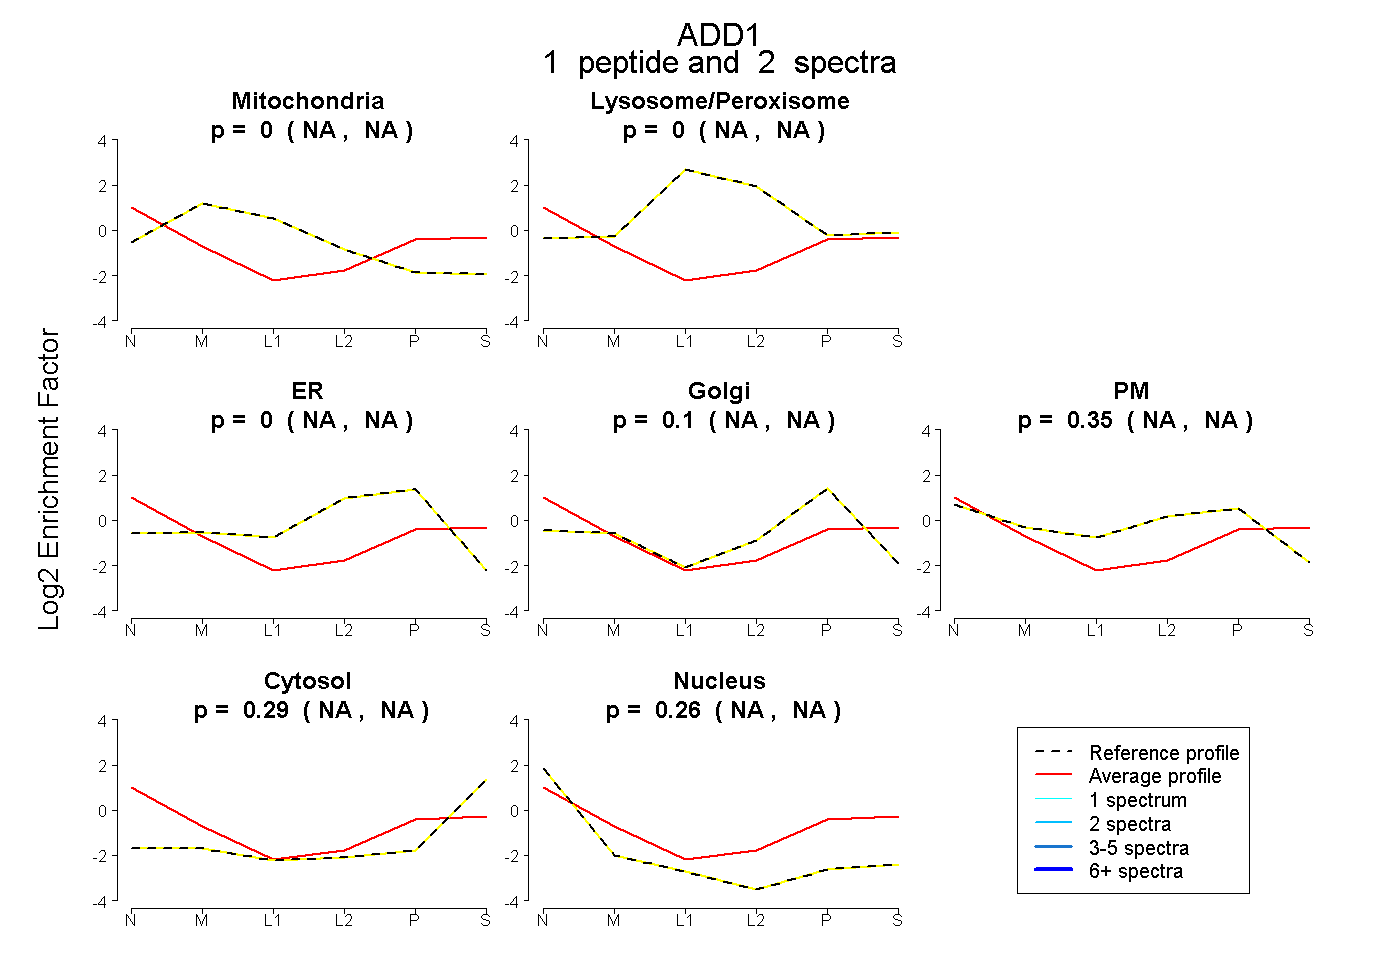 |
0.000 NA | NA |
0.000 NA | NA |
0.000 NA | NA |
0.104 NA | NA |
0.355 NA | NA |
0.285 NA | NA |
0.256 NA | NA |
|||
| Plot | Lyso | Other | |||||||||||
| Expt C |
8 peptides |
21 spectra |
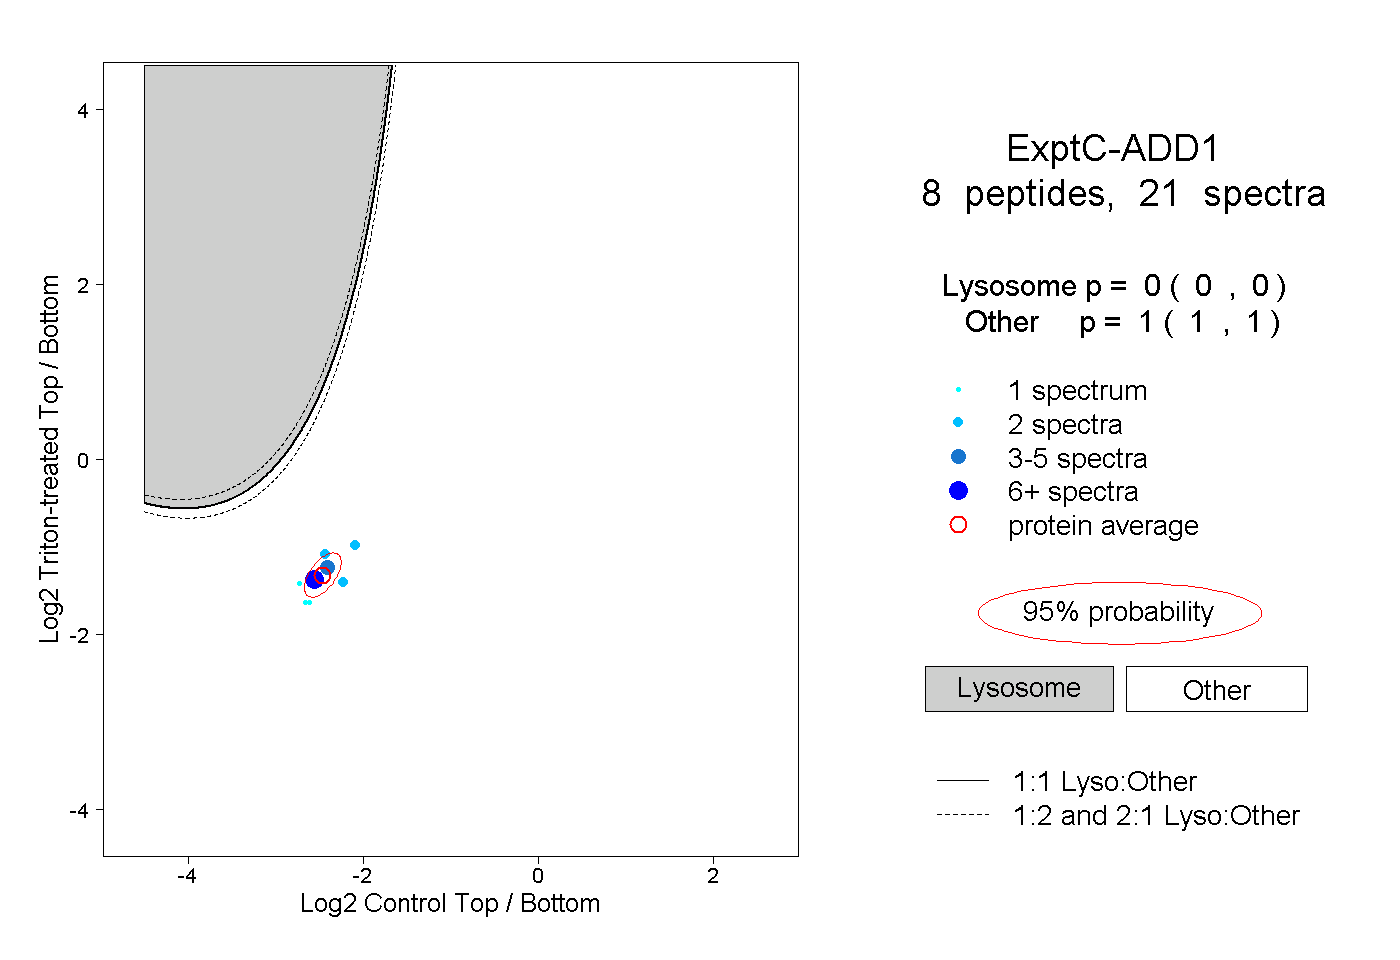 |
0.000 0.000 | 0.000 |
1.000 1.000 | 1.000 |
||||||||
| Plot | Lyso | Other | |||||||||||
| Expt D |
2 peptides |
3 spectra |
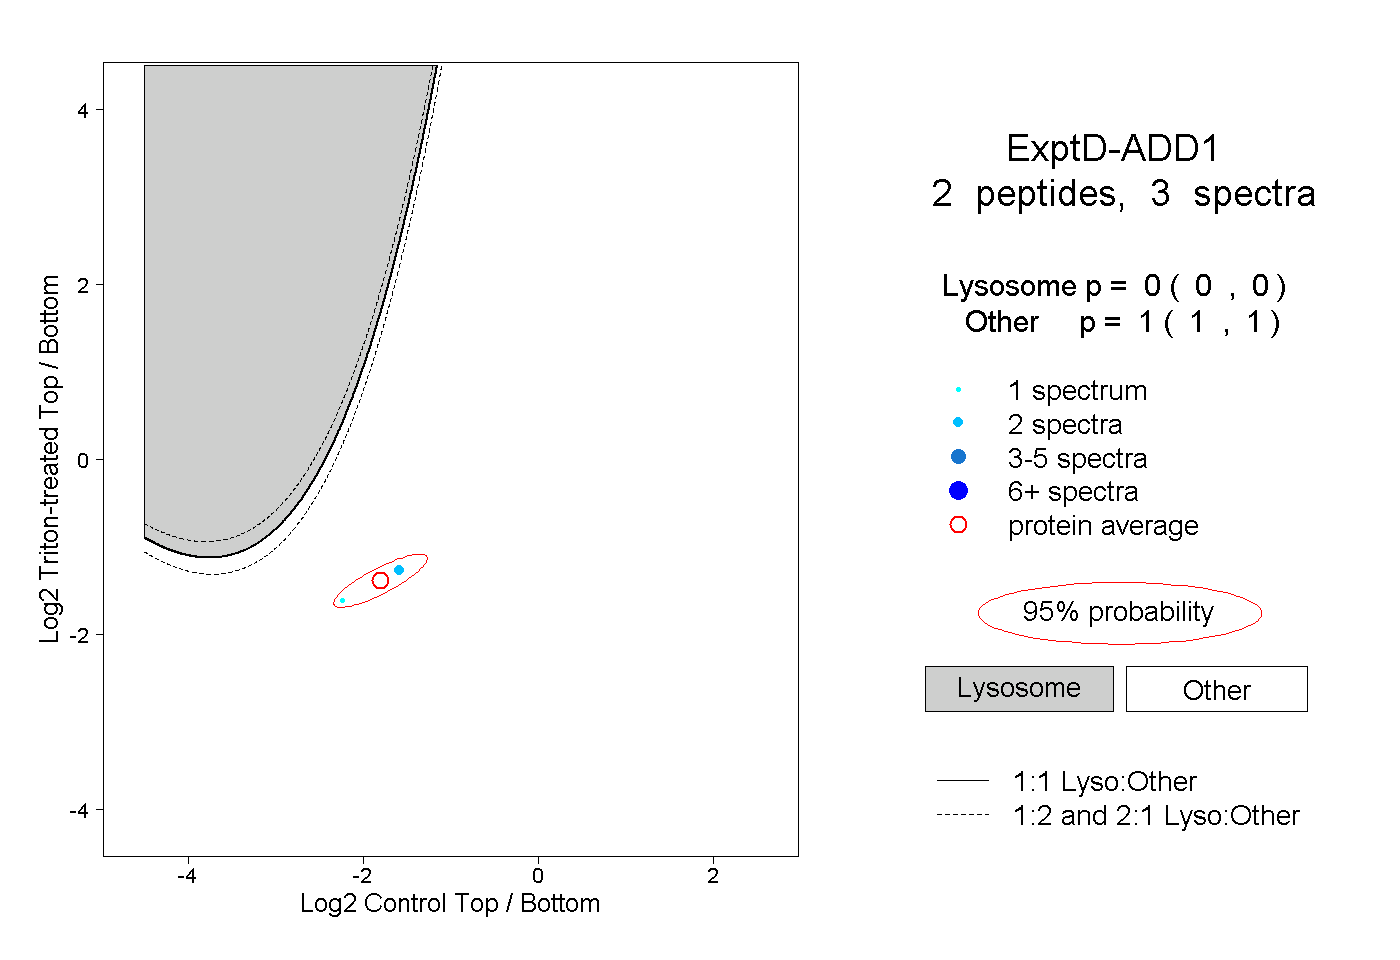 |
0.000 0.000 | 0.000 |
1.000 1.000 | 1.000 |