 12
12peptides
spectra
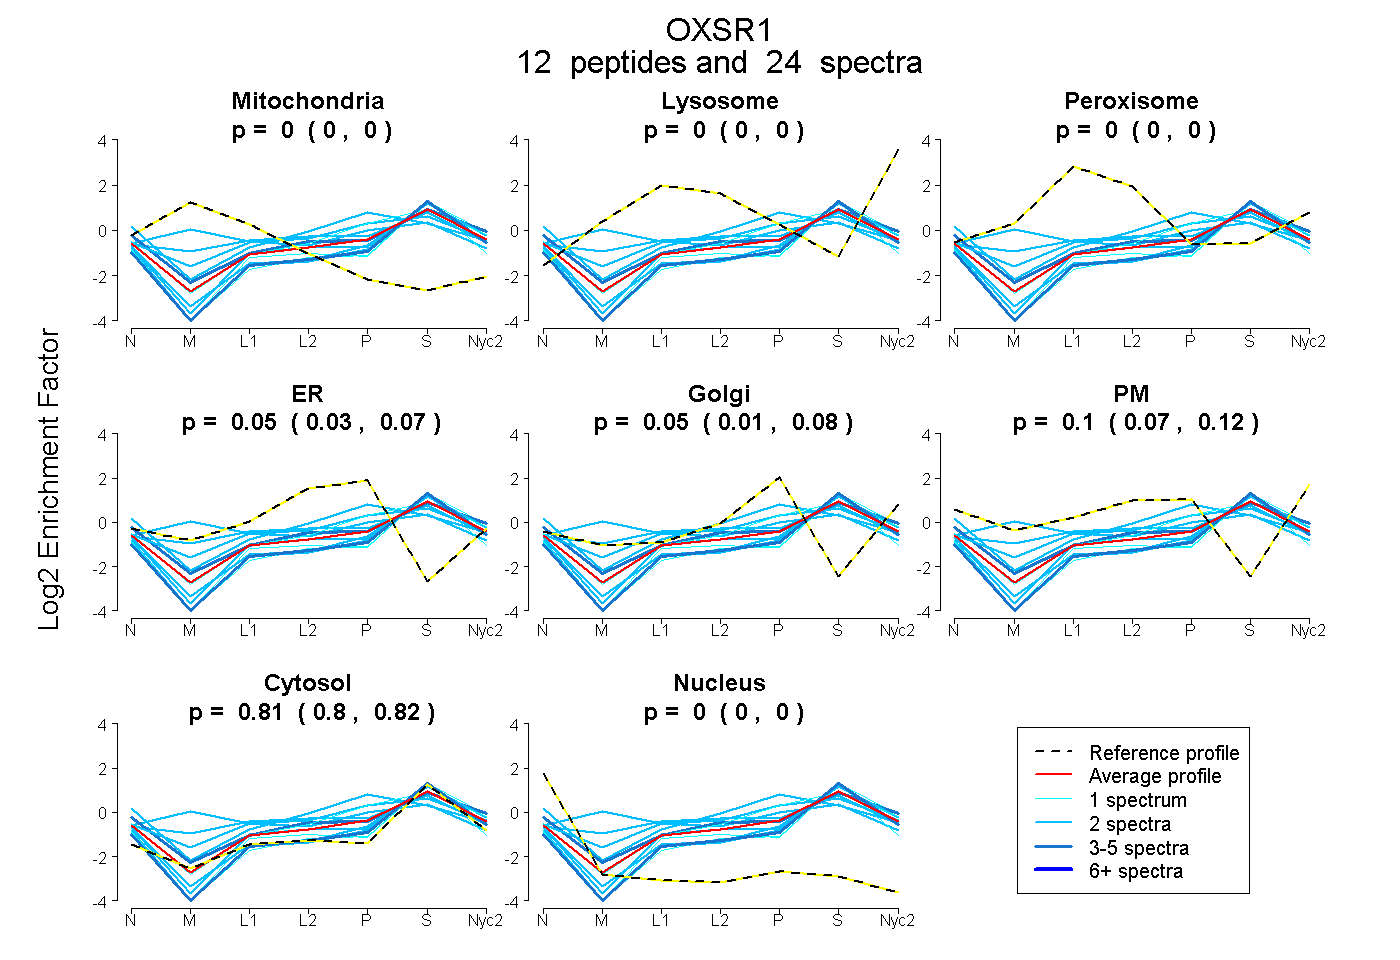
0.000 | 0.000
0.000 | 0.000
0.000 | 0.000
0.027 | 0.065
0.015 | 0.077
0.067 | 0.121
0.795 | 0.816
0.000 | 0.000
| Plot | Mito | Lyso | Perox | ER | Golgi | PM | Cytosol | Nucleus | |||||
| Expt A |
12 peptides |
24 spectra |
|
0.000 0.000 | 0.000 |
0.000 0.000 | 0.000 |
0.000 0.000 | 0.000 |
0.047 0.027 | 0.065 |
0.049 0.015 | 0.077 |
0.097 0.067 | 0.121 |
0.807 0.795 | 0.816 |
0.000 0.000 | 0.000 |
| 3 spectra, EVLEGLEYLHK | 0.000 | 0.000 | 0.000 | 0.000 | 0.000 | 0.258 | 0.742 | 0.000 | ||
| 2 spectra, EFLQEK | 0.000 | 0.000 | 0.000 | 0.316 | 0.048 | 0.088 | 0.547 | 0.000 | ||
| 2 spectra, DELWLVMK | 0.206 | 0.000 | 0.161 | 0.000 | 0.199 | 0.000 | 0.435 | 0.000 | ||
| 2 spectra, APTISER | 0.000 | 0.000 | 0.000 | 0.000 | 0.000 | 0.100 | 0.900 | 0.000 | ||
| 2 spectra, MISLCLQK | 0.000 | 0.000 | 0.133 | 0.108 | 0.182 | 0.000 | 0.577 | 0.000 | ||
| 4 spectra, VPISLVLR | 0.000 | 0.000 | 0.000 | 0.000 | 0.001 | 0.000 | 0.990 | 0.008 | ||
| 2 spectra, AAISQLR | 0.000 | 0.000 | 0.000 | 0.000 | 0.014 | 0.000 | 0.956 | 0.030 | ||
| 1 spectrum, RPTAAELLR | 0.000 | 0.000 | 0.000 | 0.034 | 0.231 | 0.029 | 0.707 | 0.000 | ||
| 2 spectra, GGVLDESTIATILR | 0.000 | 0.000 | 0.000 | 0.000 | 0.099 | 0.000 | 0.901 | 0.000 | ||
| 2 spectra, CQTSMDELLK | 0.022 | 0.000 | 0.234 | 0.072 | 0.079 | 0.000 | 0.593 | 0.000 | ||
| 1 spectrum, DTAEGVSQELISAGLVDGR | 0.000 | 0.000 | 0.000 | 0.000 | 0.000 | 0.031 | 0.969 | 0.000 | ||
| 1 spectrum, DLVIVAANLQK | 0.000 | 0.000 | 0.000 | 0.000 | 0.000 | 0.000 | 0.944 | 0.056 |
| Plot | Mito | Lyso or Perox | ER | Golgi | PM | Cytosol | Nucleus | ||||||
| Expt B |
1 peptide |
1 spectrum |
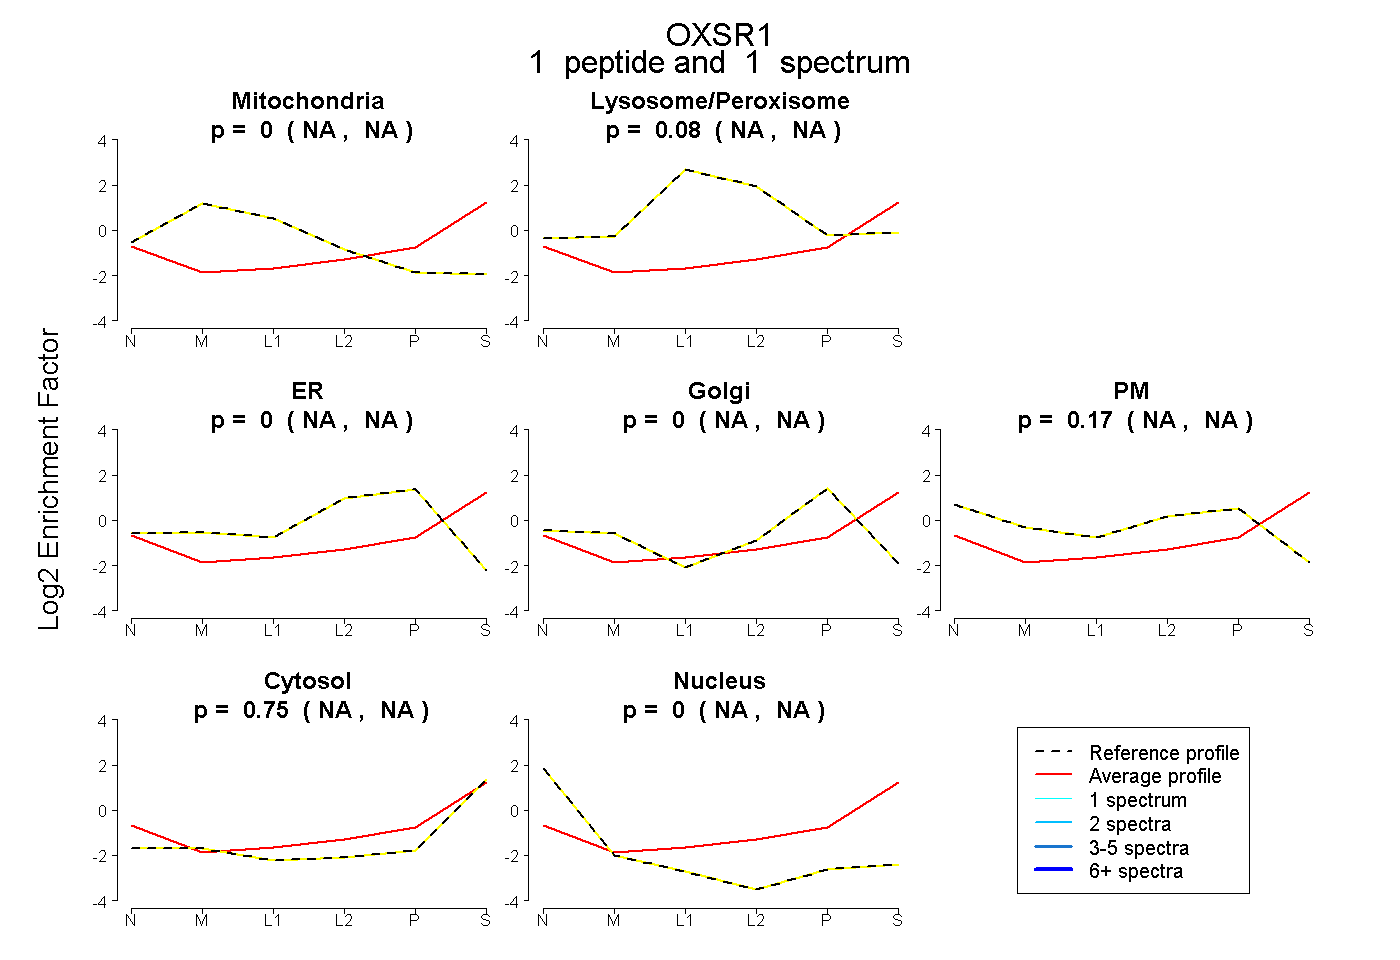 |
0.000 NA | NA |
0.077 NA | NA |
0.000 NA | NA |
0.000 NA | NA |
0.170 NA | NA |
0.753 NA | NA |
0.000 NA | NA |
|||
| Plot | Lyso | Other | |||||||||||
| Expt C |
7 peptides |
18 spectra |
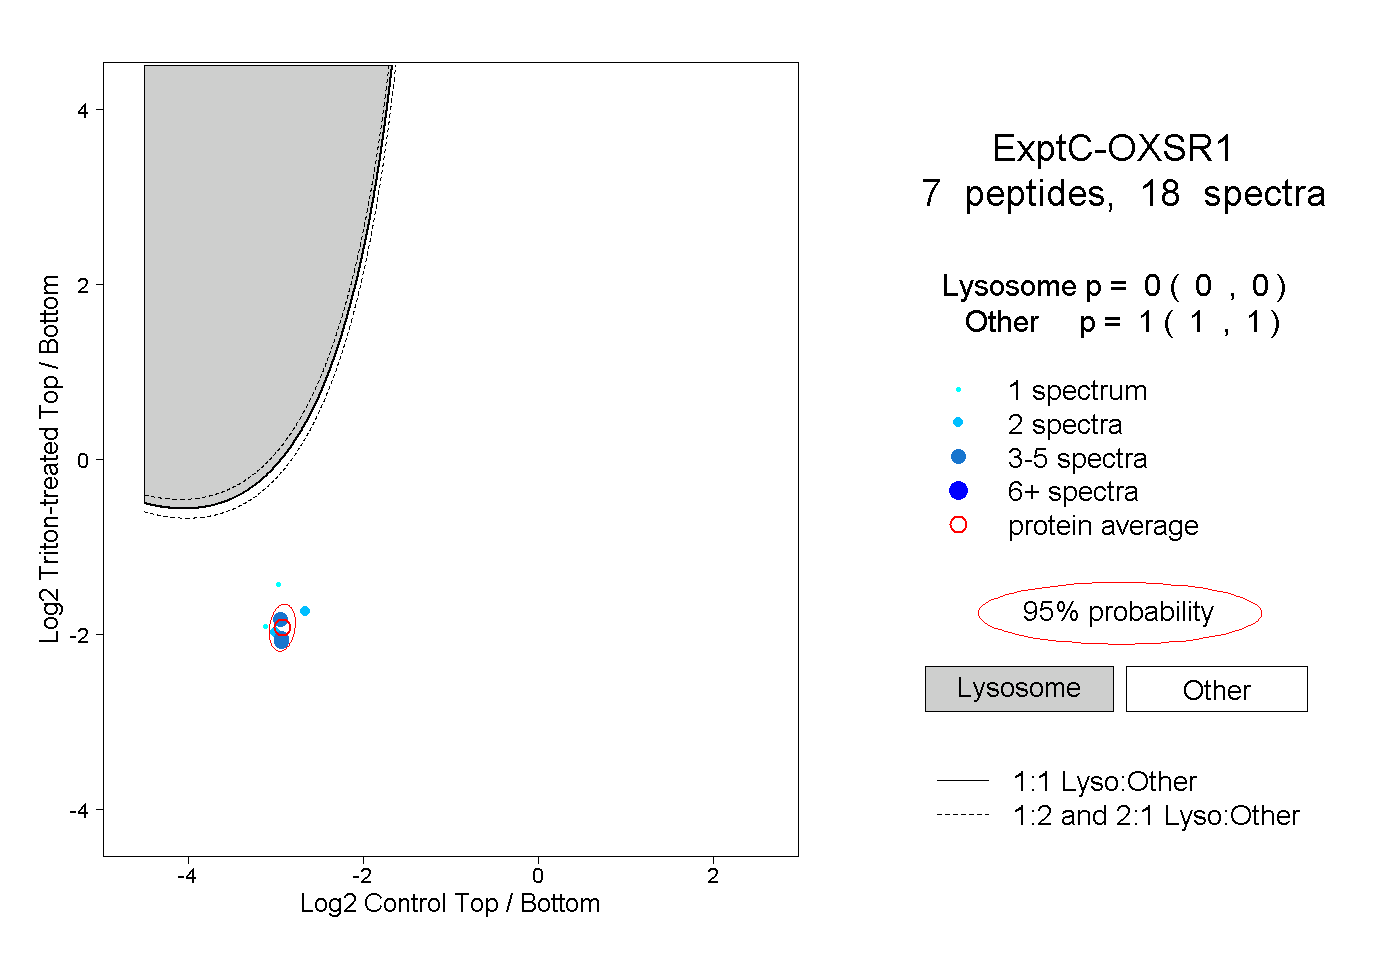 |
0.000 0.000 | 0.000 |
1.000 1.000 | 1.000 |