 3
3peptides
spectra
0.000 | 0.198
0.000 | 0.202
0.000 | 0.157
0.000 | 0.091
0.000 | 0.319
0.000 | 0.594
0.110 | 0.289
0.067 | 0.266
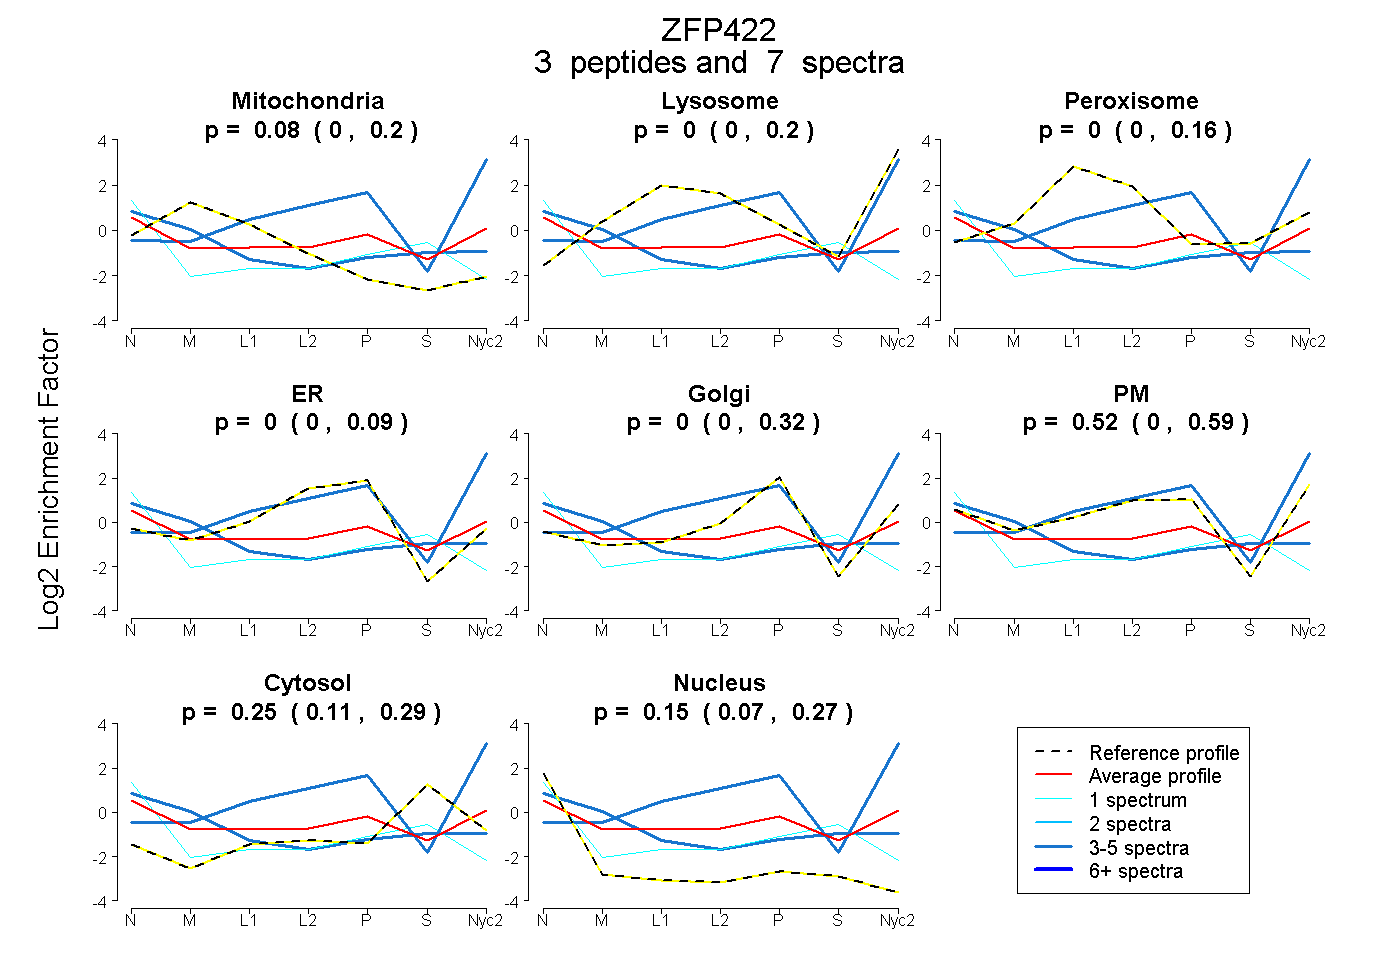
| Plot | Mito | Lyso | Perox | ER | Golgi | PM | Cytosol | Nucleus | |||||
| Expt A |
3 peptides |
7 spectra |
|
0.081 0.000 | 0.198 |
0.000 0.000 | 0.202 |
0.000 0.000 | 0.157 |
0.000 0.000 | 0.091 |
0.000 0.000 | 0.319 |
0.518 0.000 | 0.594 |
0.250 0.110 | 0.289 |
0.151 0.067 | 0.266 |
| 3 spectra, GAASGLFK | 0.340 | 0.000 | 0.000 | 0.000 | 0.000 | 0.213 | 0.245 | 0.202 | ||
| 3 spectra, SASEGK | 0.000 | 0.462 | 0.000 | 0.000 | 0.299 | 0.239 | 0.000 | 0.000 | ||
| 1 spectrum, IHTGEKPYK | 0.000 | 0.000 | 0.074 | 0.035 | 0.000 | 0.082 | 0.328 | 0.482 |