18
18peptides
spectra
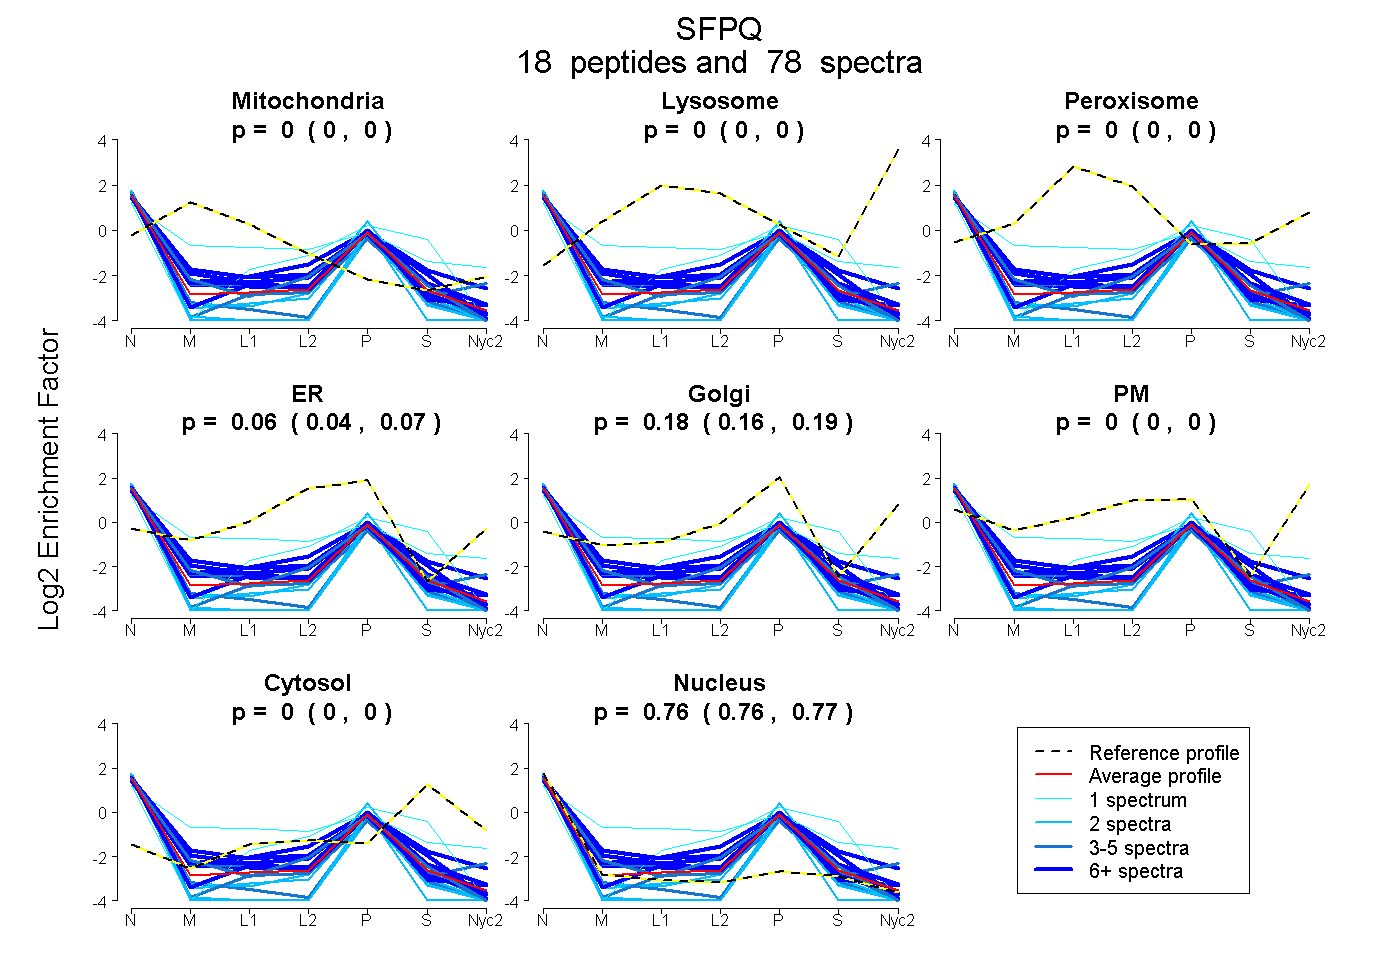
0.000 | 0.000
0.000 | 0.000
0.000 | 0.000
0.039 | 0.072
0.162 | 0.194
0.000 | 0.000
0.000 | 0.000
0.761 | 0.767
4peptides
spectra
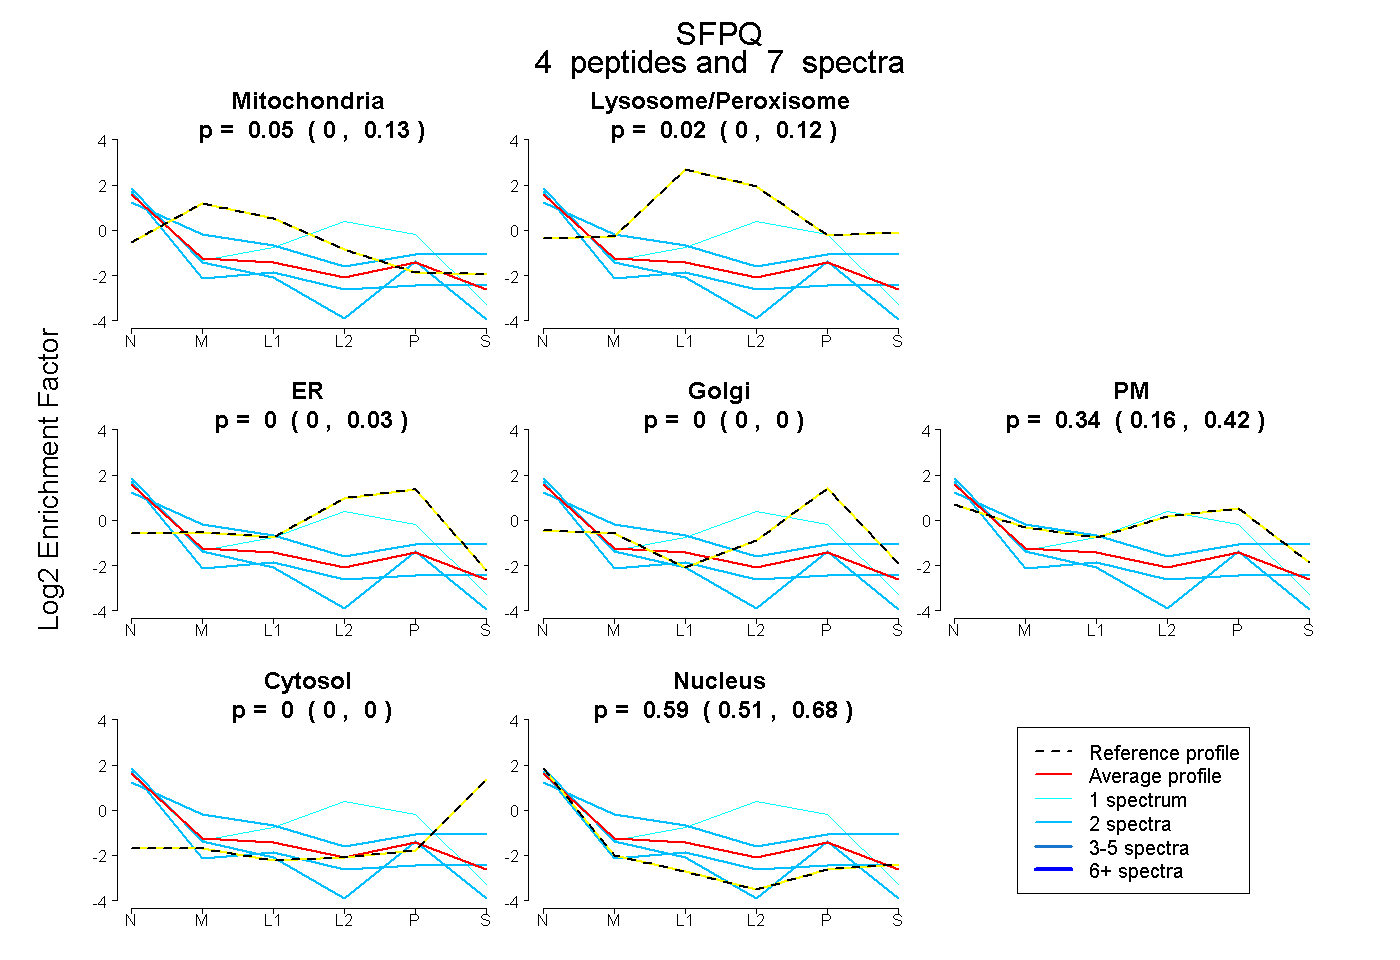
0.000 | 0.133
0.000 | 0.117
0.000 | 0.031
0.000 | 0.000
0.163 | 0.424
0.000 | 0.000
0.514 | 0.677