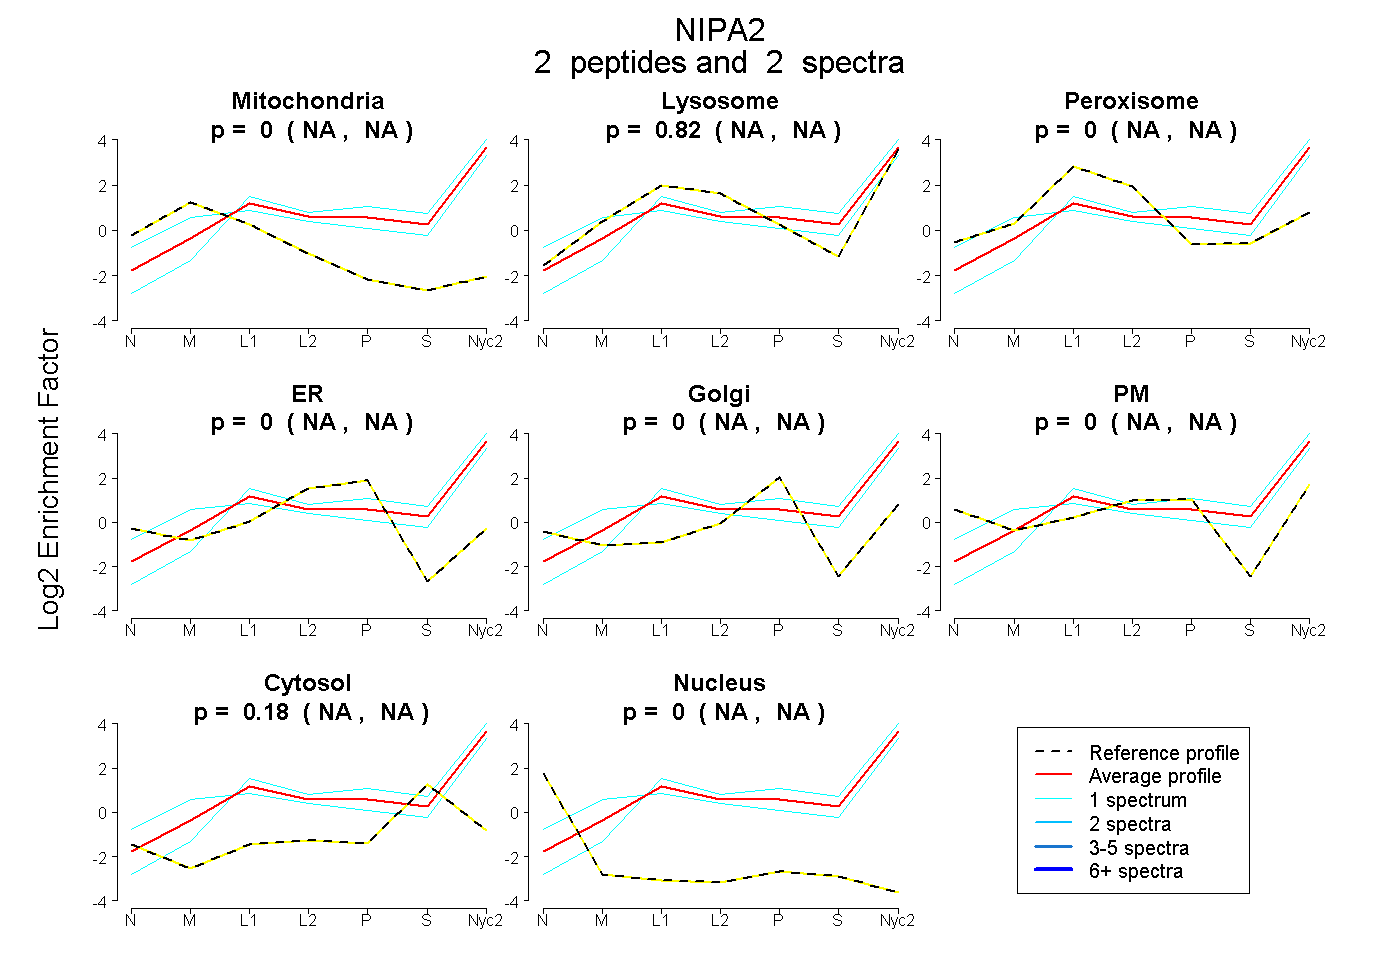
 2
2peptides
spectra
NA | NA
NA | NA
NA | NA
NA | NA
NA | NA
NA | NA
NA | NA
NA | NA
| Plot | Mito | Lyso | Perox | ER | Golgi | PM | Cytosol | Nucleus | |||||
| Expt A |
2 peptides |
2 spectra |
|
0.000 NA | NA |
0.816 NA | NA |
0.000 NA | NA |
0.000 NA | NA |
0.000 NA | NA |
0.000 NA | NA |
0.184 NA | NA |
0.000 NA | NA |
| 1 spectrum, EEEIETLNEMSHK | 0.000 | 0.819 | 0.000 | 0.000 | 0.000 | 0.000 | 0.181 | 0.000 | ||
| 1 spectrum, AGQGGHAYLK | 0.000 | 0.763 | 0.000 | 0.000 | 0.000 | 0.066 | 0.170 | 0.000 |
| Plot | Lyso | Other | |||||||||||
| Expt C |
4 peptides |
9 spectra |
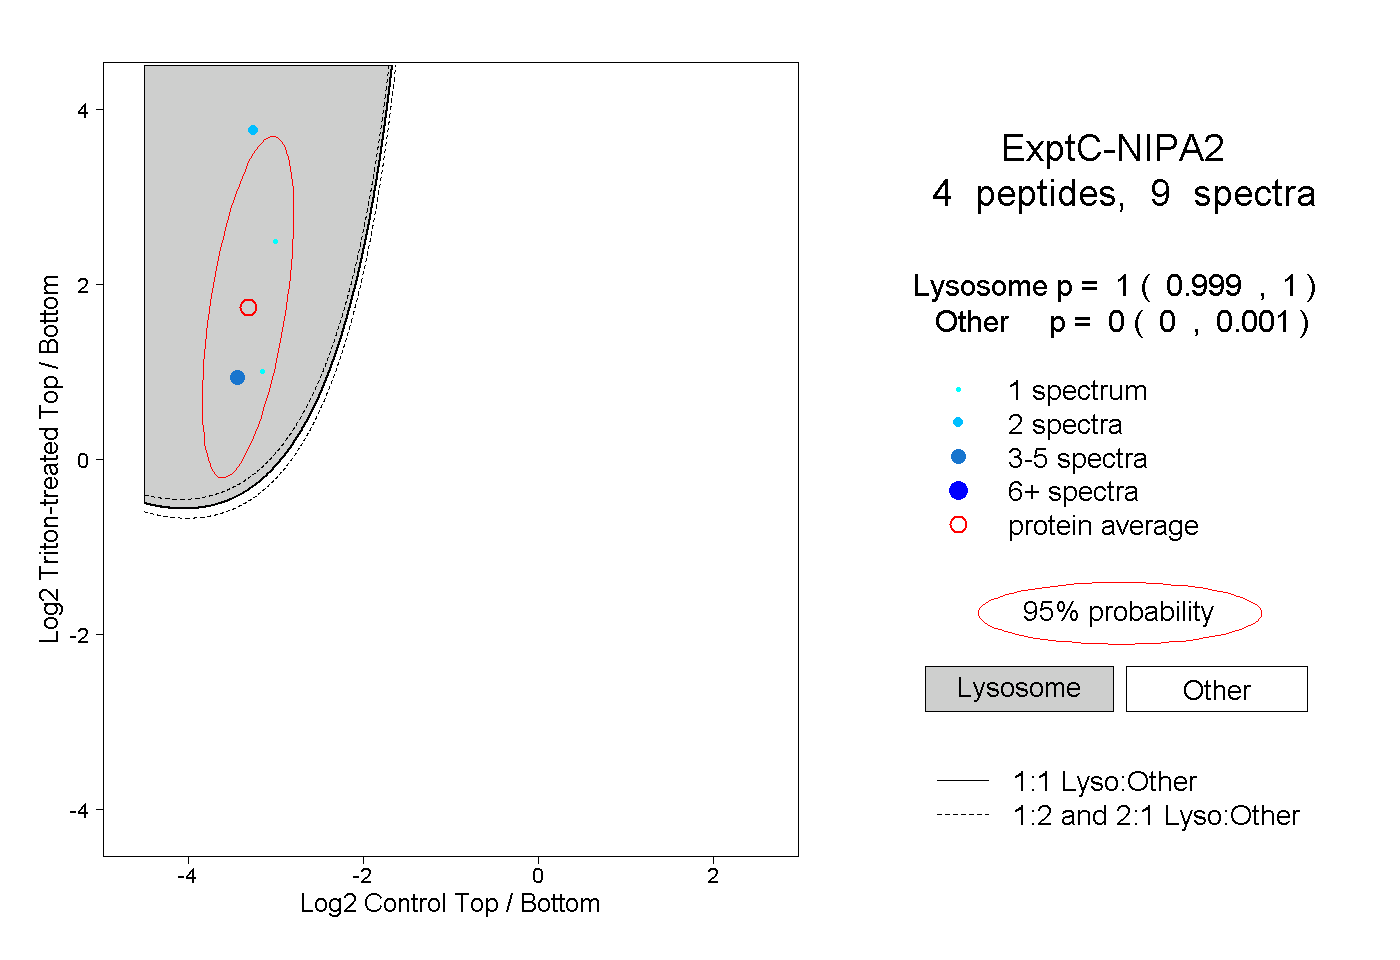 |
1.000 0.999 | 1.000 |
0.000 0.000 | 0.001 |