13
13peptides
spectra
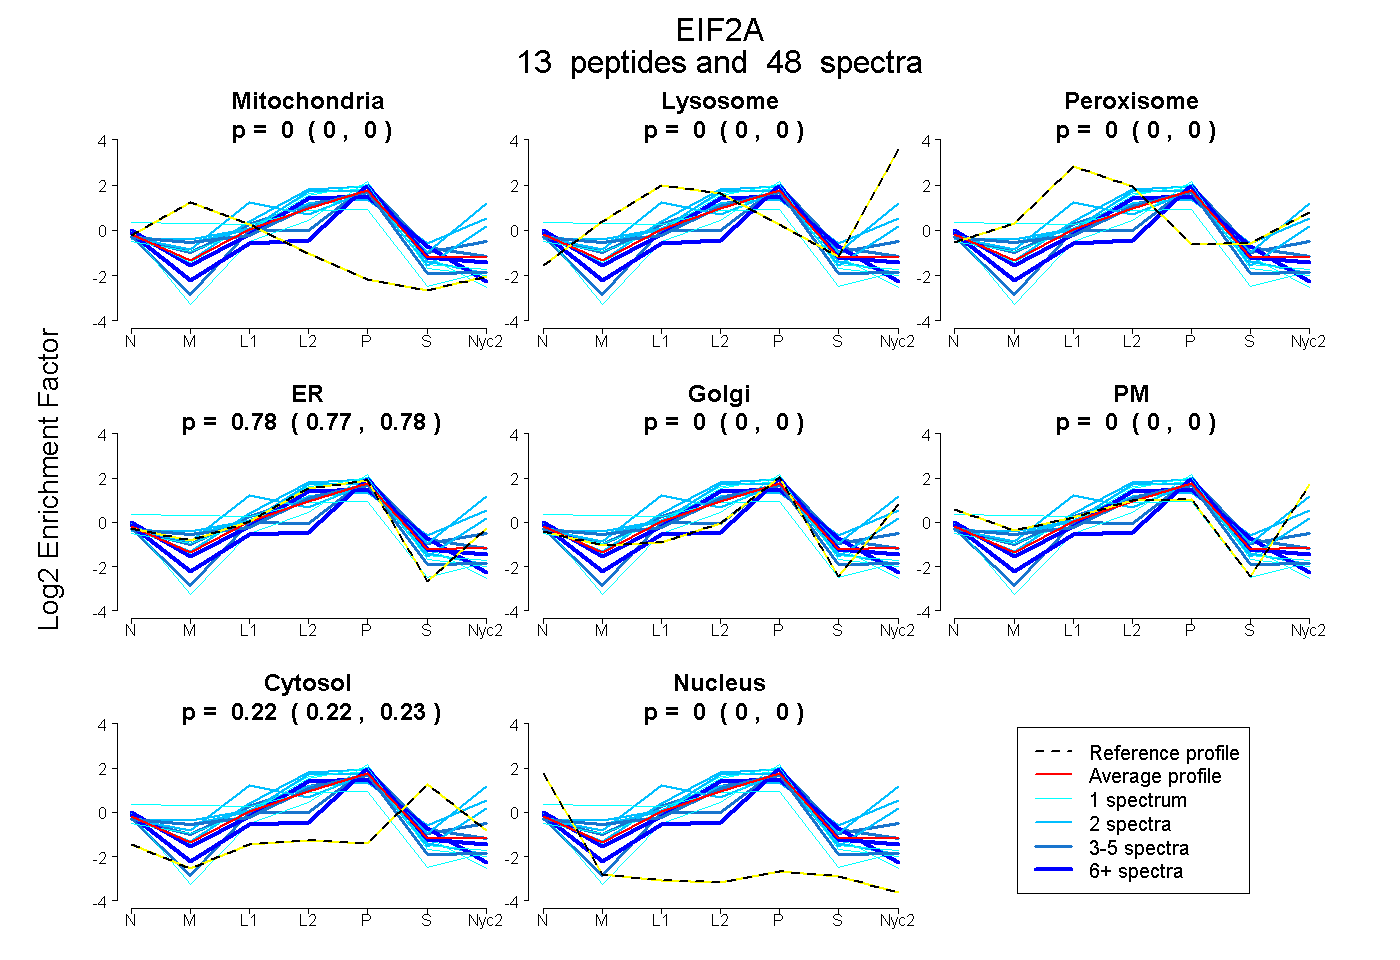
0.000 | 0.000
0.000 | 0.000
0.000 | 0.000
0.768 | 0.781
0.000 | 0.000
0.000 | 0.000
0.218 | 0.231
0.000 | 0.000
6peptides
spectra
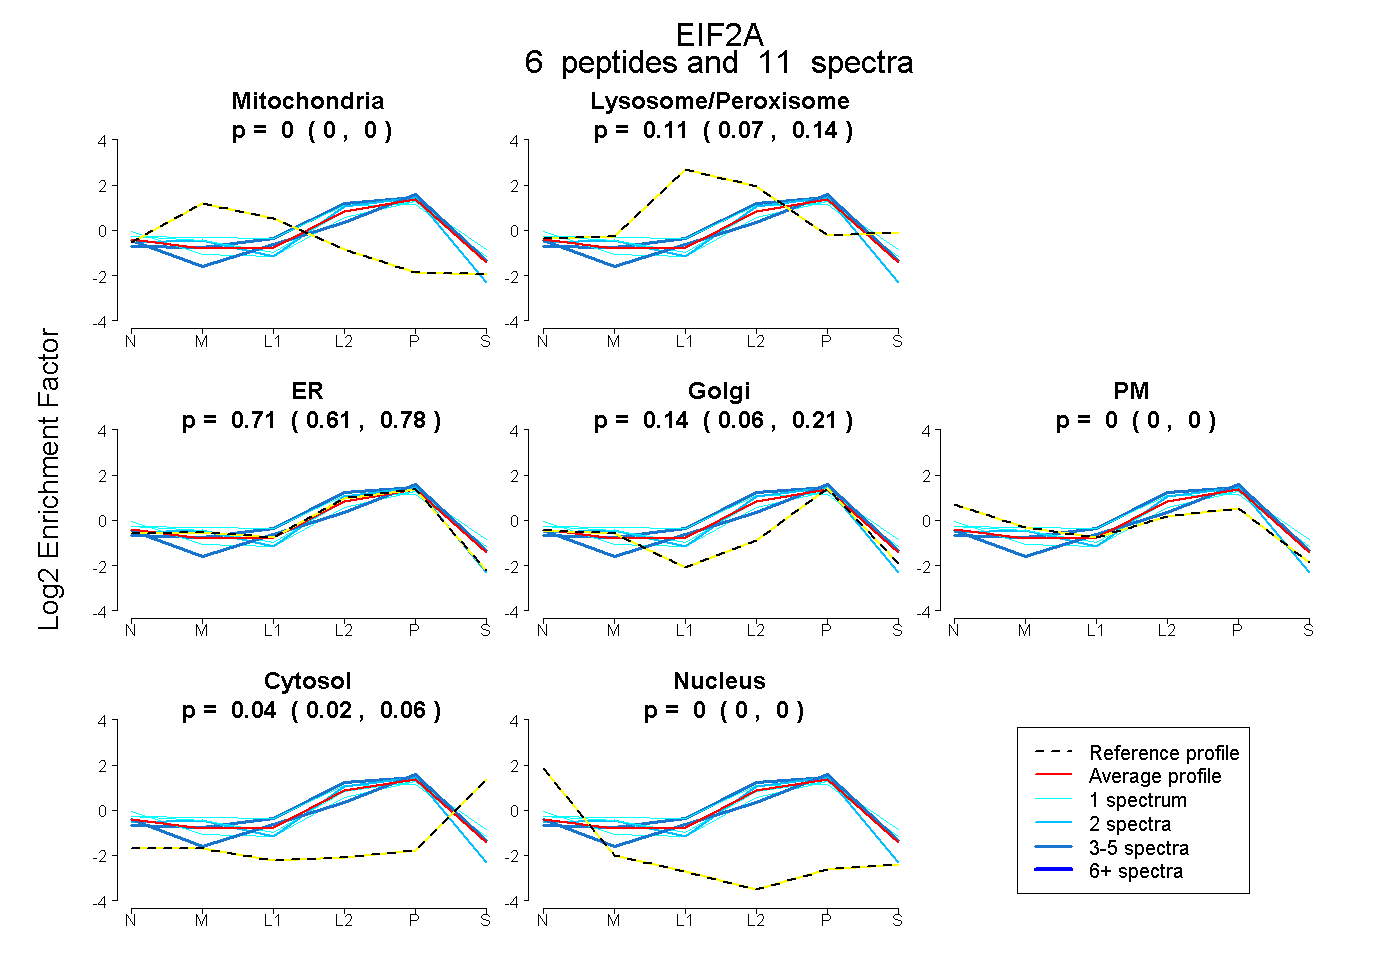
0.000 | 0.000
0.074 | 0.137
0.614 | 0.781
0.061 | 0.205
0.000 | 0.000
0.021 | 0.064
0.000 | 0.000