 13
13peptides
spectra
0.000 | 0.000
0.000 | 0.000
0.000 | 0.000
0.768 | 0.781
0.000 | 0.000
0.000 | 0.000
0.218 | 0.231
0.000 | 0.000
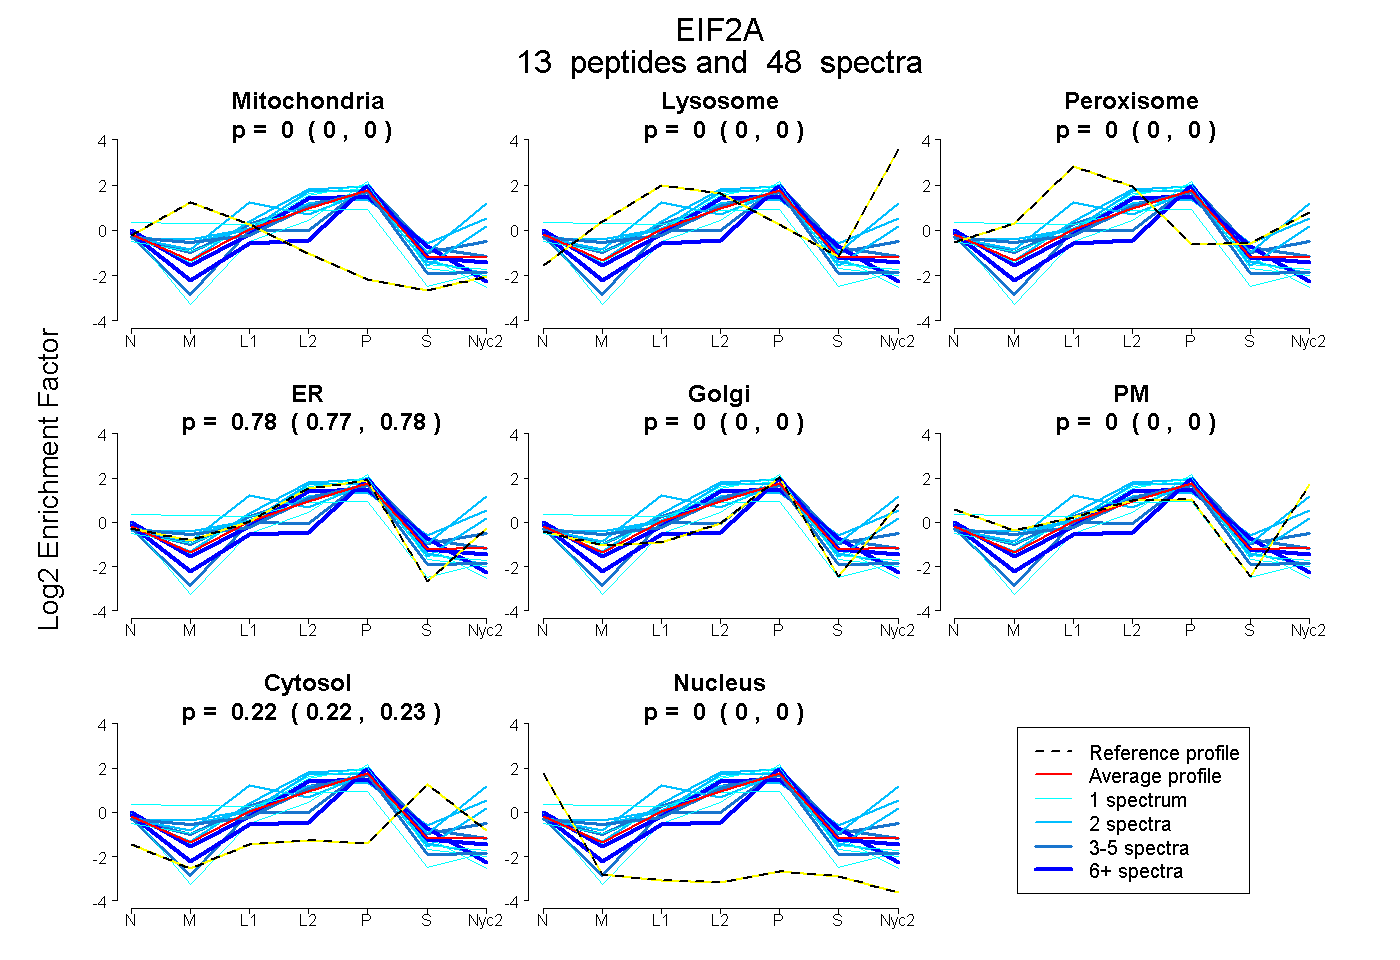
| Plot | Mito | Lyso | Perox | ER | Golgi | PM | Cytosol | Nucleus | |||||
| Expt A |
13 peptides |
48 spectra |
|
0.000 0.000 | 0.000 |
0.000 0.000 | 0.000 |
0.000 0.000 | 0.000 |
0.775 0.768 | 0.781 |
0.000 0.000 | 0.000 |
0.000 0.000 | 0.000 |
0.225 0.218 | 0.231 |
0.000 0.000 | 0.000 |
| 4 spectra, EQAAAGK | 0.000 | 0.000 | 0.000 | 0.592 | 0.028 | 0.000 | 0.369 | 0.011 | ||
| 4 spectra, ATAVLVIASTDVDK | 0.000 | 0.000 | 0.114 | 0.700 | 0.000 | 0.000 | 0.187 | 0.000 | ||
| 1 spectrum, NDLAPTPVPQSAPR | 0.000 | 0.000 | 0.000 | 0.678 | 0.000 | 0.000 | 0.202 | 0.121 | ||
| 1 spectrum, VNNGYK | 0.349 | 0.000 | 0.000 | 0.651 | 0.000 | 0.000 | 0.000 | 0.000 | ||
| 1 spectrum, LYQYPNFAGPQAALANK | 0.000 | 0.000 | 0.000 | 0.798 | 0.000 | 0.000 | 0.161 | 0.040 | ||
| 2 spectra, IWHYTGSLLYK | 0.000 | 0.099 | 0.362 | 0.000 | 0.539 | 0.000 | 0.000 | 0.000 | ||
| 2 spectra, CDPVFDFGTGPR | 0.000 | 0.000 | 0.004 | 0.866 | 0.000 | 0.000 | 0.131 | 0.000 | ||
| 8 spectra, GQMEVWDVK | 0.000 | 0.000 | 0.000 | 0.708 | 0.000 | 0.000 | 0.257 | 0.035 | ||
| 2 spectra, ATVFNLK | 0.000 | 0.126 | 0.171 | 0.369 | 0.175 | 0.000 | 0.160 | 0.000 | ||
| 1 spectrum, VAVYVPGSK | 0.000 | 0.000 | 0.000 | 0.874 | 0.000 | 0.000 | 0.106 | 0.020 | ||
| 2 spectra, TGTCLK | 0.000 | 0.098 | 0.052 | 0.783 | 0.000 | 0.000 | 0.067 | 0.000 | ||
| 3 spectra, VTMLWNK | 0.084 | 0.000 | 0.000 | 0.800 | 0.000 | 0.000 | 0.065 | 0.051 | ||
| 17 spectra, VATAYRPPALR | 0.000 | 0.000 | 0.000 | 0.453 | 0.197 | 0.000 | 0.237 | 0.113 |
| Plot | Mito | Lyso or Perox | ER | Golgi | PM | Cytosol | Nucleus | ||||||
| Expt B |
6 peptides |
11 spectra |
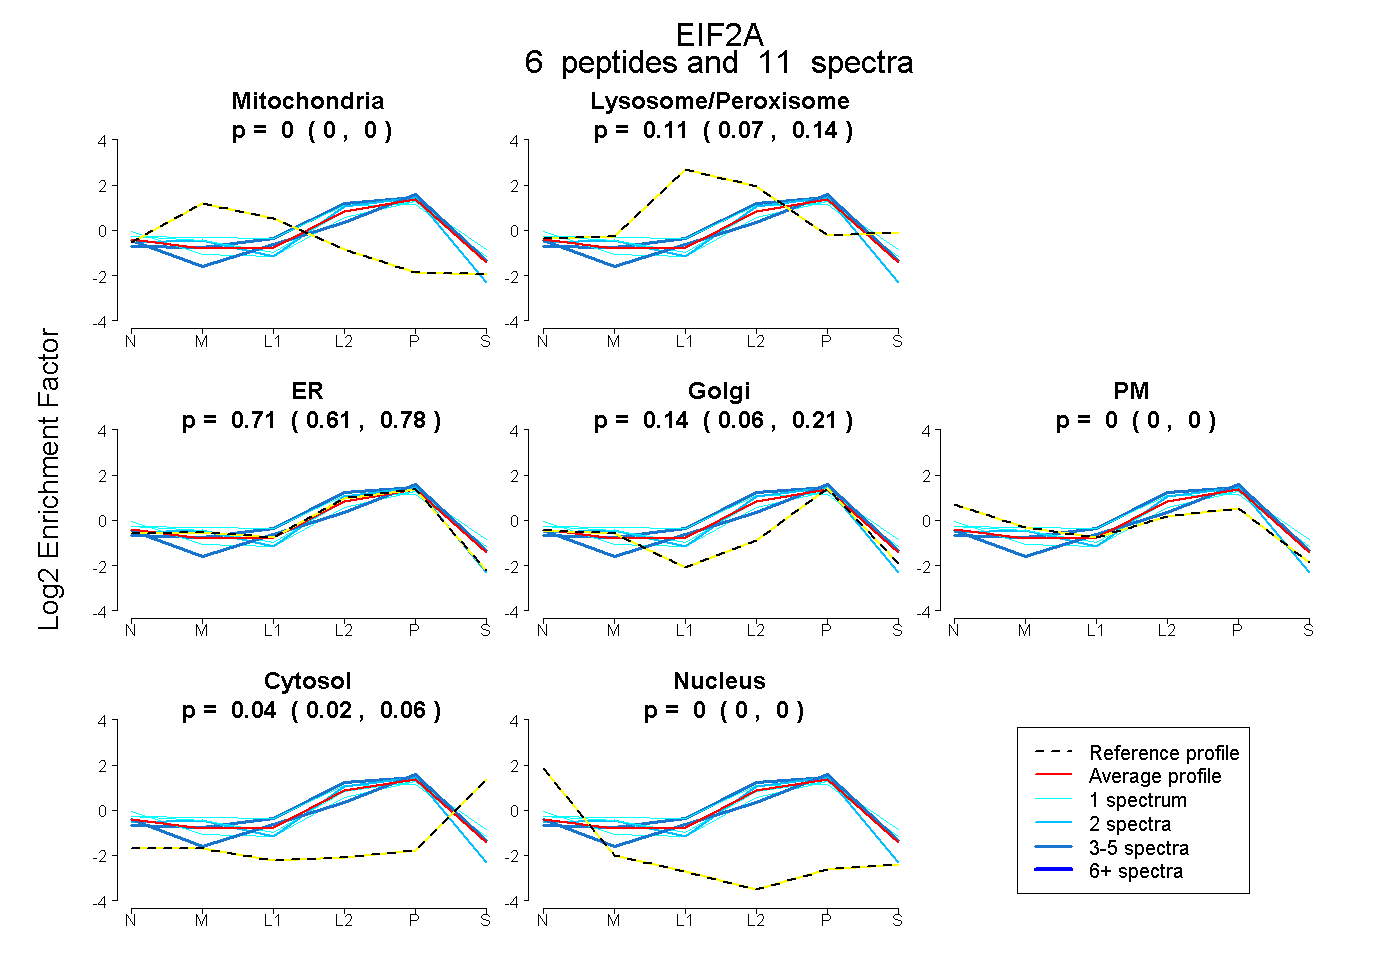 |
0.000 0.000 | 0.000 |
0.108 0.074 | 0.137 |
0.708 0.614 | 0.781 |
0.140 0.061 | 0.205 |
0.000 0.000 | 0.000 |
0.045 0.021 | 0.064 |
0.000 0.000 | 0.000 |
|||
| Plot | Lyso | Other | |||||||||||
| Expt C |
16 peptides |
55 spectra |
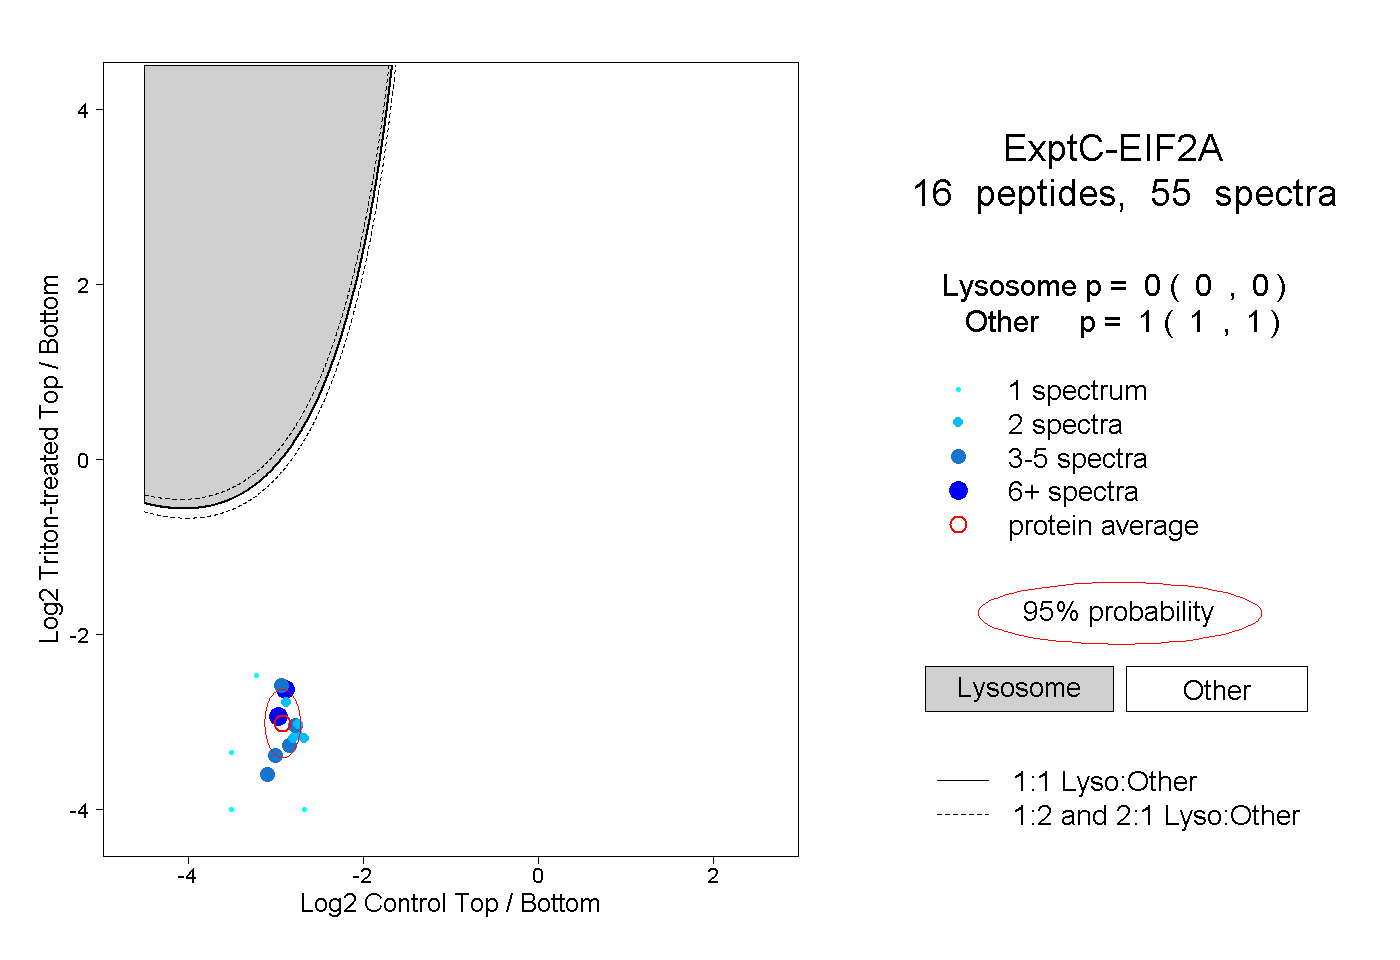 |
0.000 0.000 | 0.000 |
1.000 1.000 | 1.000 |
||||||||
| Plot | Lyso | Other | |||||||||||
| Expt D |
2 peptides |
3 spectra |
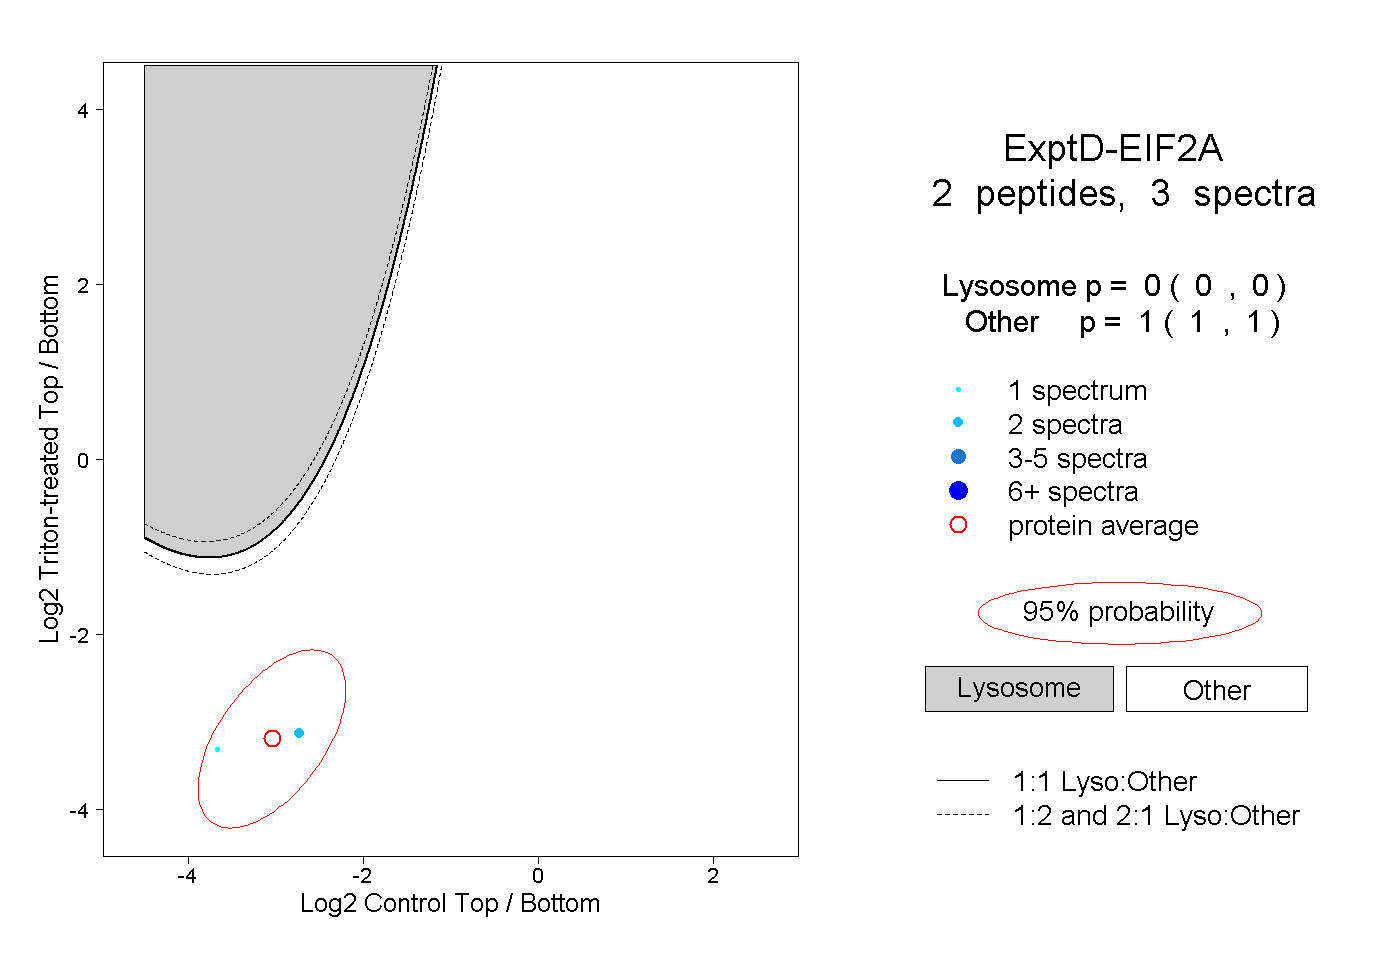 |
0.000 0.000 | 0.000 |
1.000 1.000 | 1.000 |