 3
3peptides
spectra
0.000 | 0.000
0.000 | 0.040
0.135 | 0.303
0.000 | 0.173
0.000 | 0.150
0.000 | 0.104
0.588 | 0.726
0.000 | 0.022
3peptides
spectra
0.000 | 0.000
1.000 | 1.000
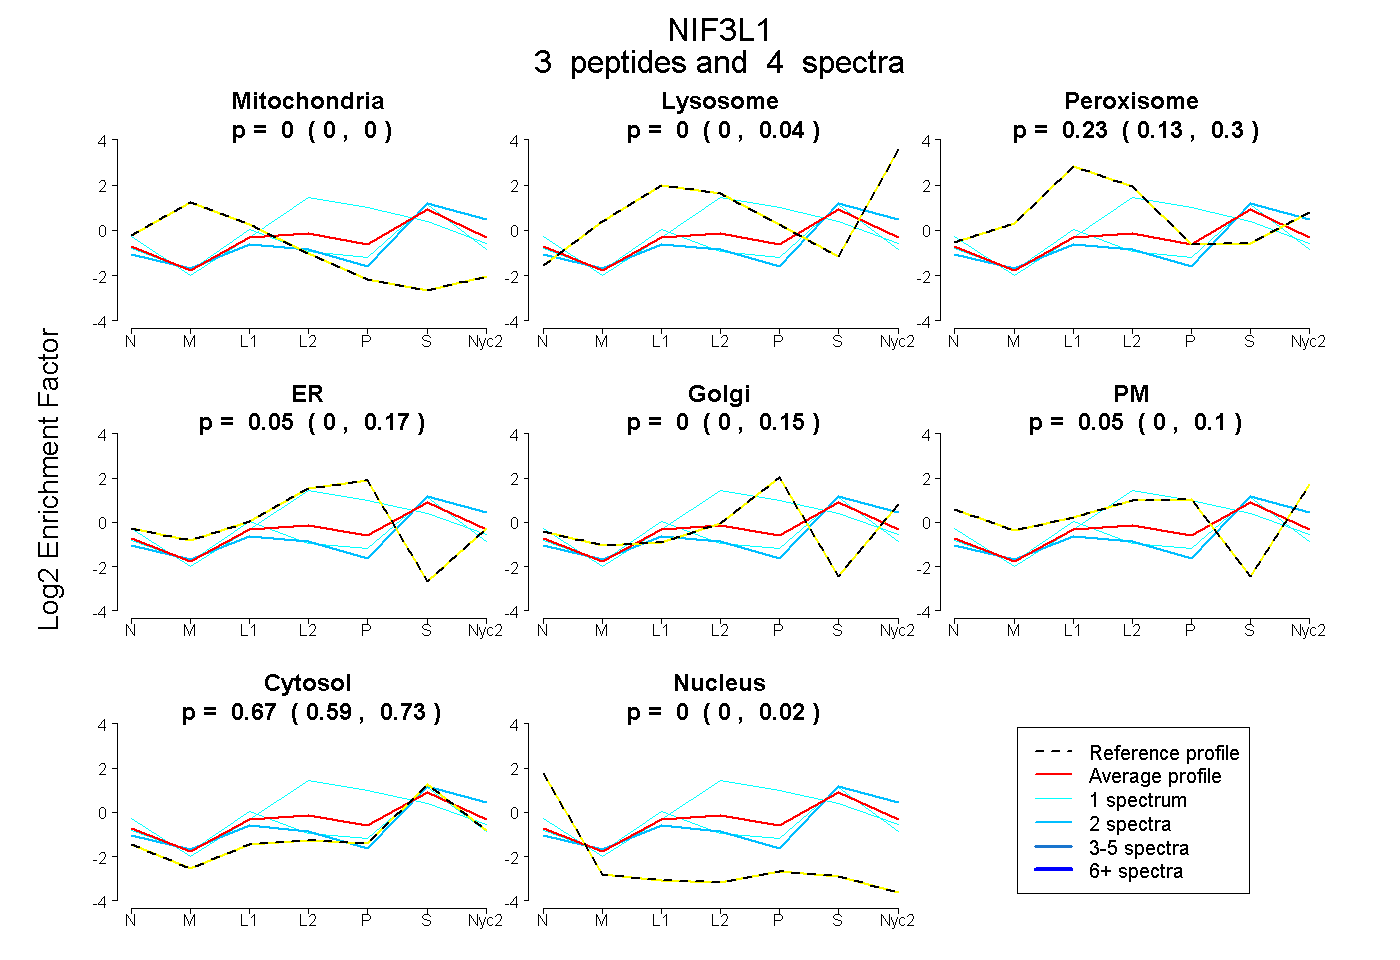
| Plot | Mito | Lyso | Perox | ER | Golgi | PM | Cytosol | Nucleus | |||||
| Expt A |
3 peptides |
4 spectra |
|
0.000 0.000 | 0.000 |
0.000 0.000 | 0.040 |
0.229 0.135 | 0.303 |
0.054 0.000 | 0.173 |
0.000 0.000 | 0.150 |
0.046 0.000 | 0.104 |
0.671 0.588 | 0.726 |
0.000 0.000 | 0.022 |
||
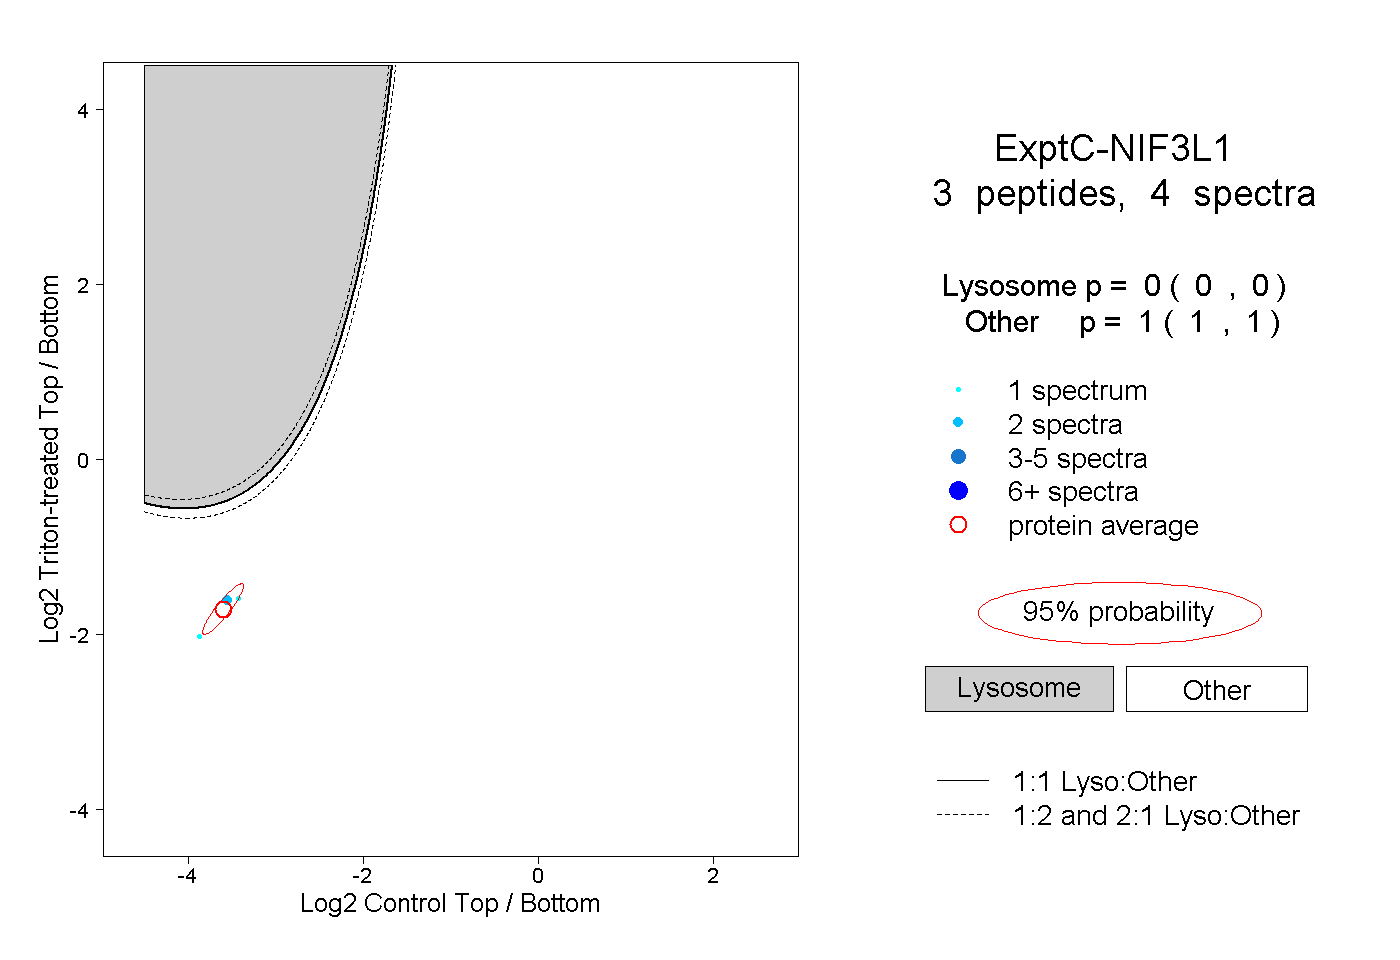
| Plot | Lyso | Other | |||||||||||
| Expt C |
3 peptides |
4 spectra |
|
0.000 0.000 | 0.000 |
1.000 1.000 | 1.000 |