 1
1peptide
spectra
0.000 | 0.000
0.000 | 0.000
0.256 | 0.321
0.227 | 0.293
0.104 | 0.220
0.158 | 0.248
0.051 | 0.091
0.000 | 0.000
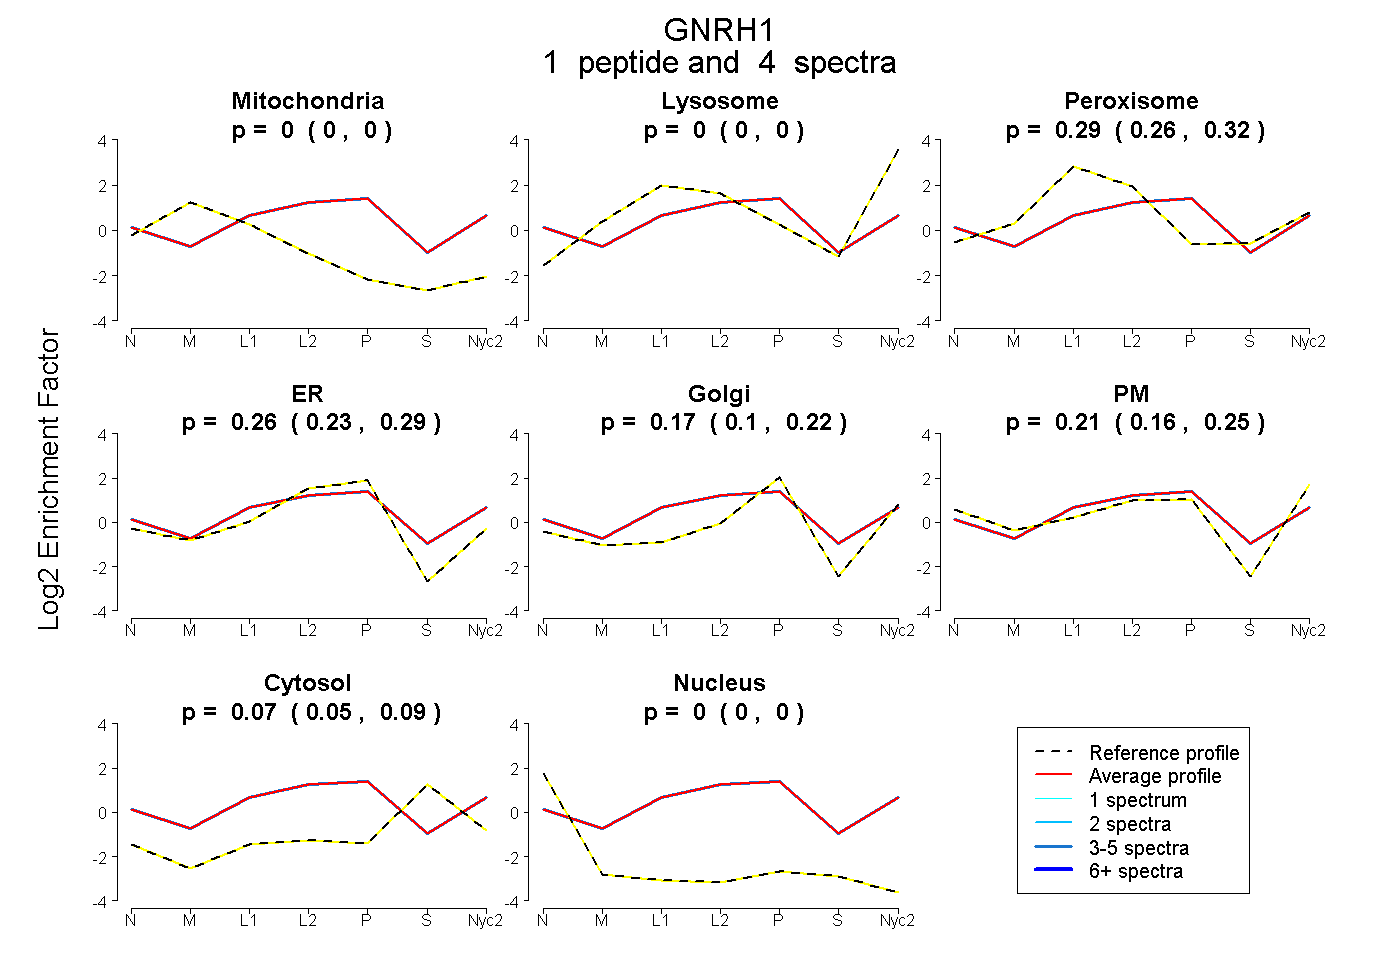
| Plot | Mito | Lyso | Perox | ER | Golgi | PM | Cytosol | Nucleus | |||||
| Expt A |
1 peptide |
4 spectra |
|
0.000 0.000 | 0.000 |
0.000 0.000 | 0.000 |
0.292 0.256 | 0.321 |
0.262 0.227 | 0.293 |
0.168 0.104 | 0.220 |
0.206 0.158 | 0.248 |
0.073 0.051 | 0.091 |
0.000 0.000 | 0.000 |