10
10peptides
spectra
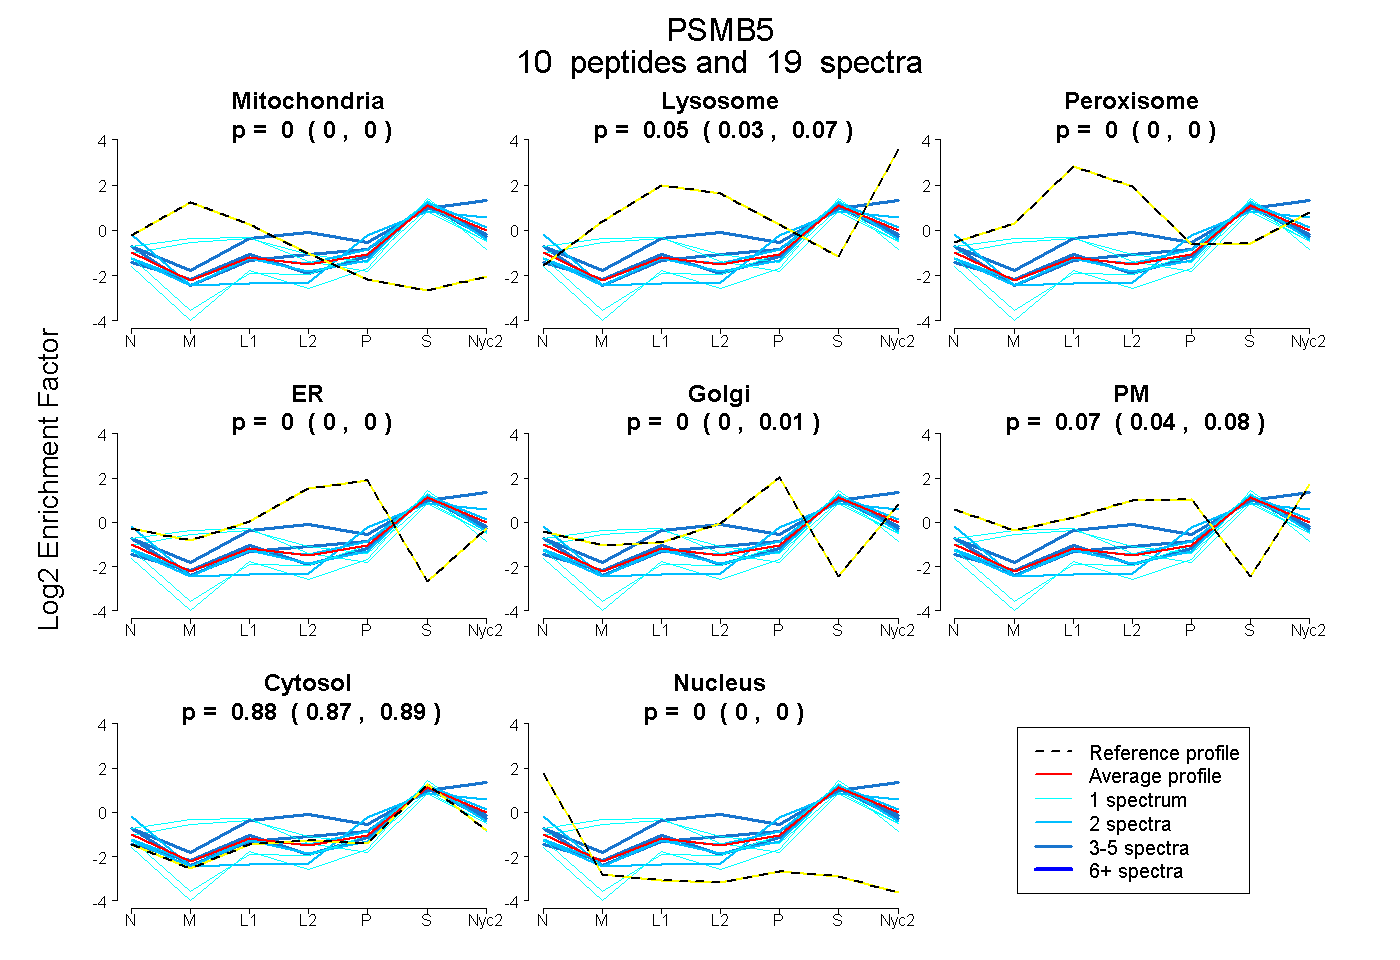
0.000 | 0.000
0.032 | 0.072
0.000 | 0.000
0.000 | 0.000
0.000 | 0.010
0.041 | 0.082
0.868 | 0.891
0.000 | 0.000
4peptides
spectra
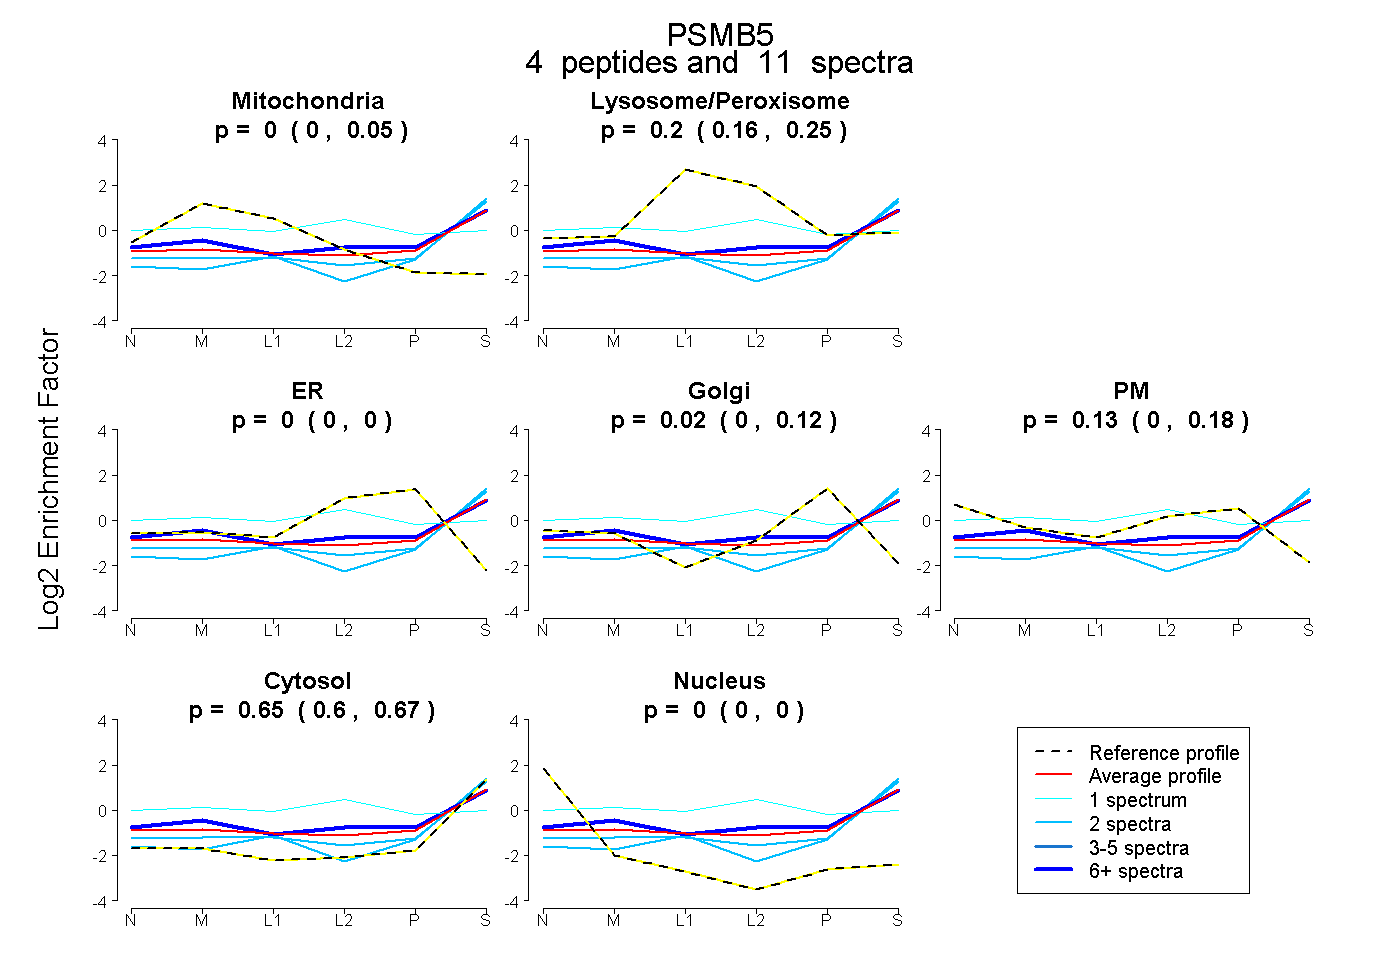
0.000 | 0.053
0.158 | 0.246
0.000 | 0.000
0.000 | 0.116
0.000 | 0.176
0.604 | 0.674
0.000 | 0.000