 10
10peptides
spectra
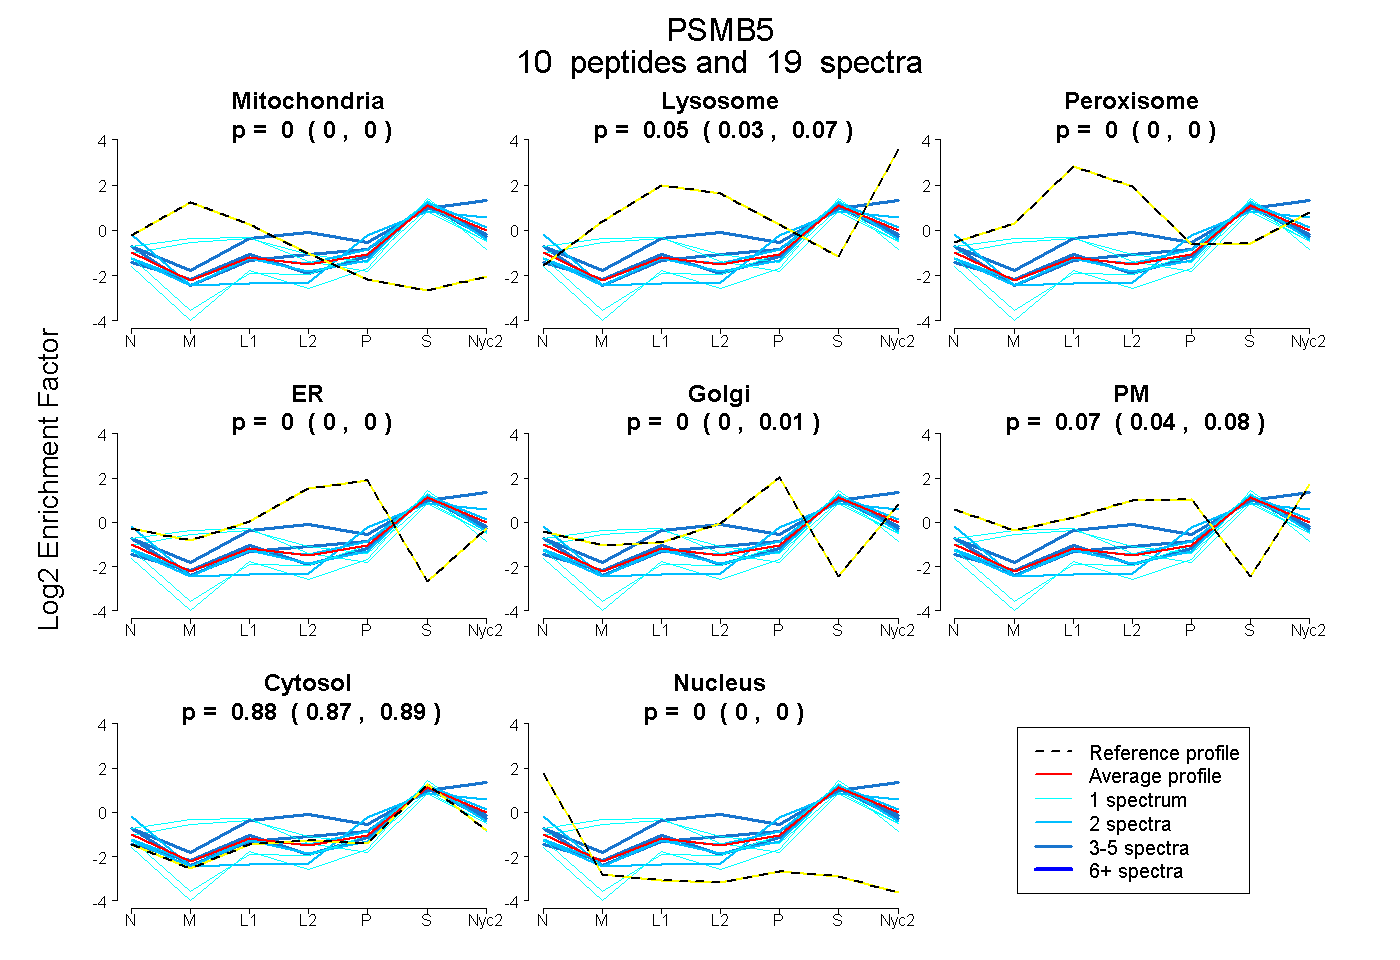
0.000 | 0.000
0.032 | 0.072
0.000 | 0.000
0.000 | 0.000
0.000 | 0.010
0.041 | 0.082
0.868 | 0.891
0.000 | 0.000
| Plot | Mito | Lyso | Perox | ER | Golgi | PM | Cytosol | Nucleus | |||||
| Expt A |
10 peptides |
19 spectra |
|
0.000 0.000 | 0.000 |
0.053 0.032 | 0.072 |
0.000 0.000 | 0.000 |
0.000 0.000 | 0.000 |
0.000 0.000 | 0.010 |
0.066 0.041 | 0.082 |
0.881 0.868 | 0.891 |
0.000 0.000 | 0.000 |
| 1 spectrum, LLANMVYQYK | 0.262 | 0.024 | 0.110 | 0.000 | 0.000 | 0.000 | 0.604 | 0.000 | ||
| 3 spectra, FQHGVIVAADSR | 0.000 | 0.334 | 0.000 | 0.000 | 0.000 | 0.042 | 0.624 | 0.000 | ||
| 2 spectra, GYSYDLQVEEAYDLAR | 0.000 | 0.000 | 0.000 | 0.000 | 0.216 | 0.000 | 0.729 | 0.054 | ||
| 1 spectrum, ATAGAYIASQTVK | 0.000 | 0.000 | 0.000 | 0.000 | 0.000 | 0.000 | 0.969 | 0.031 | ||
| 3 spectra, DAYSGGAVNLYHVR | 0.000 | 0.000 | 0.000 | 0.000 | 0.000 | 0.134 | 0.866 | 0.000 | ||
| 3 spectra, AIYQATYR | 0.000 | 0.070 | 0.000 | 0.000 | 0.000 | 0.000 | 0.930 | 0.000 | ||
| 1 spectrum, EDGWIR | 0.182 | 0.044 | 0.135 | 0.000 | 0.000 | 0.000 | 0.639 | 0.000 | ||
| 2 spectra, GPGLYYVDSEGNR | 0.000 | 0.036 | 0.000 | 0.000 | 0.000 | 0.000 | 0.950 | 0.014 | ||
| 1 spectrum, VSSDNVADLHDK | 0.000 | 0.000 | 0.000 | 0.000 | 0.000 | 0.000 | 0.945 | 0.055 | ||
| 2 spectra, ISVAAASK | 0.000 | 0.073 | 0.000 | 0.000 | 0.042 | 0.000 | 0.885 | 0.000 |
| Plot | Mito | Lyso or Perox | ER | Golgi | PM | Cytosol | Nucleus | ||||||
| Expt B |
4 peptides |
11 spectra |
 |
0.000 0.000 | 0.053 |
0.204 0.158 | 0.246 |
0.000 0.000 | 0.000 |
0.023 0.000 | 0.116 |
0.125 0.000 | 0.176 |
0.647 0.604 | 0.674 |
0.000 0.000 | 0.000 |
|||
| Plot | Lyso | Other | |||||||||||
| Expt C |
6 peptides |
19 spectra |
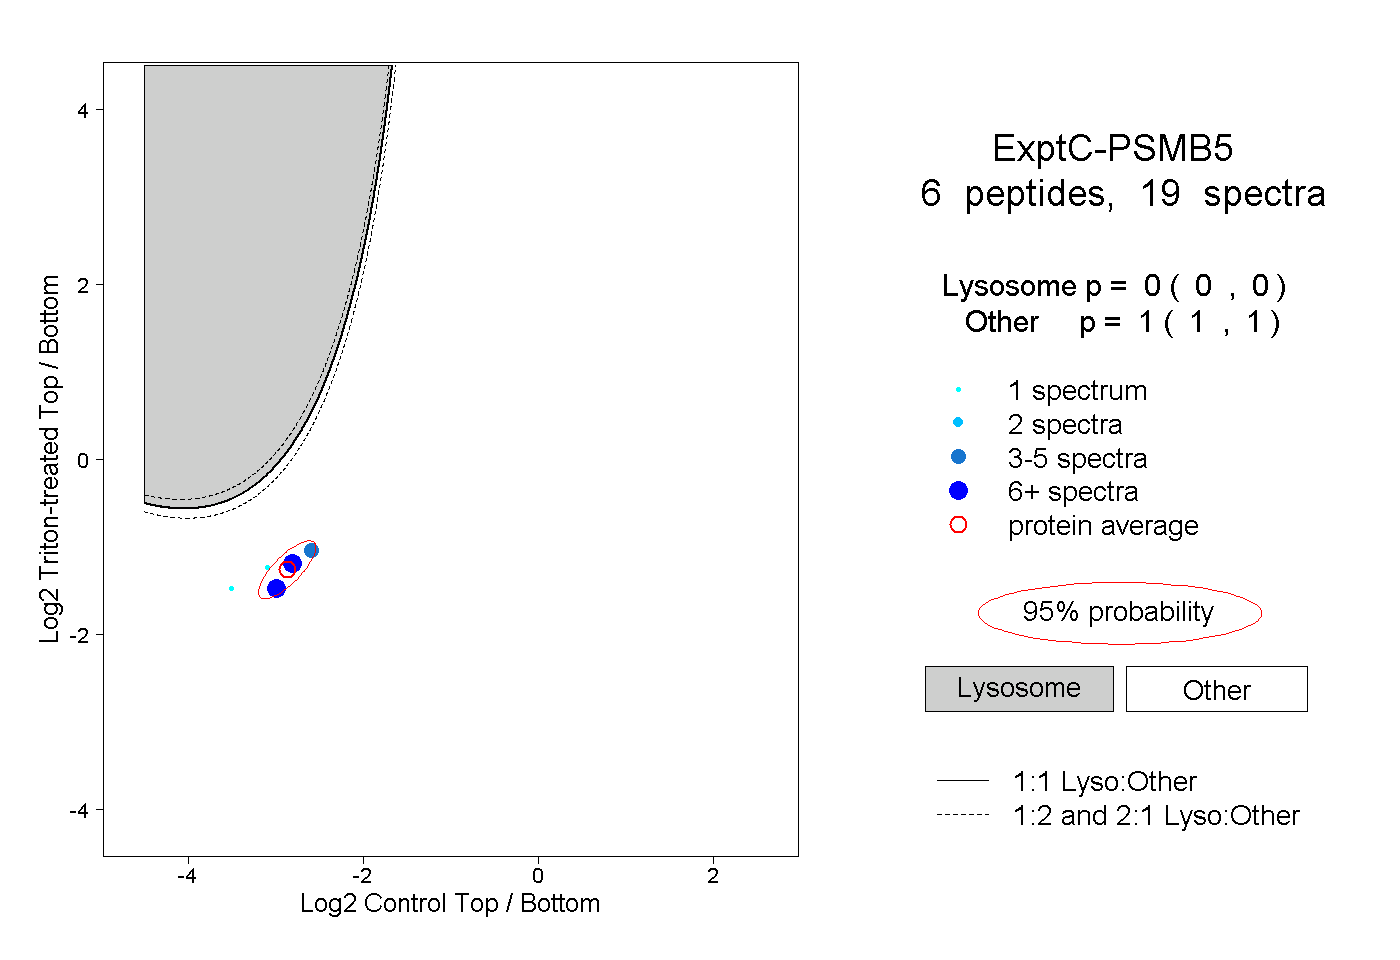 |
0.000 0.000 | 0.000 |
1.000 1.000 | 1.000 |