 13
13peptides
spectra
0.000 | 0.000
0.000 | 0.000
0.000 | 0.000
0.000 | 0.000
0.000 | 0.000
0.000 | 0.000
0.997 | 1.000
0.000 | 0.001
| Plot | Mito | Lyso | Perox | ER | Golgi | PM | Cytosol | Nucleus | |||||
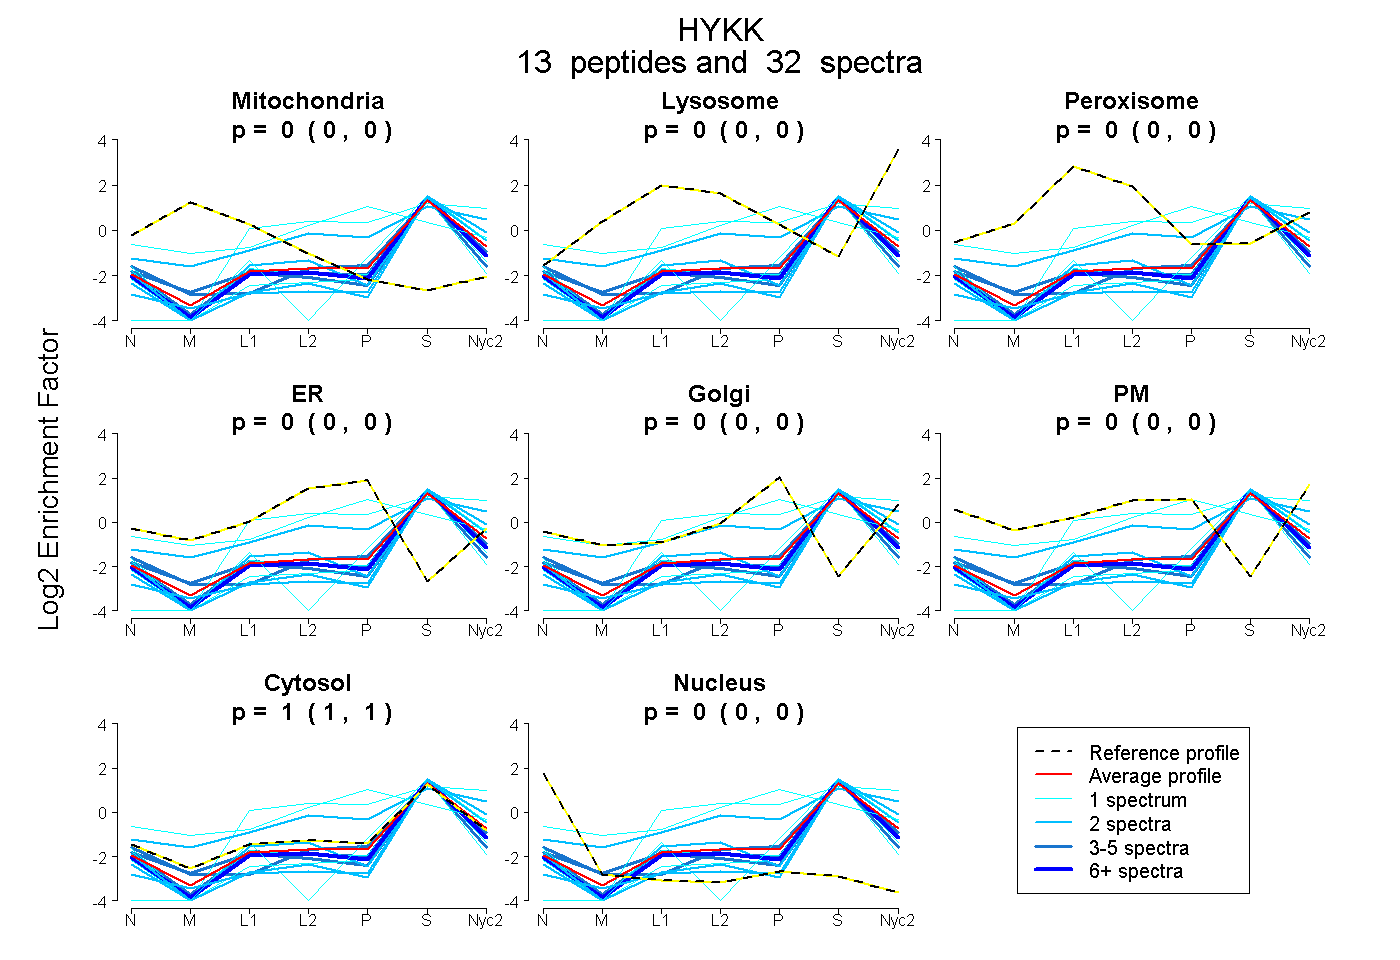
| Expt A |
13 peptides |
32 spectra |
|
0.000 0.000 | 0.000 |
0.000 0.000 | 0.000 |
0.000 0.000 | 0.000 |
0.000 0.000 | 0.000 |
0.000 0.000 | 0.000 |
0.000 0.000 | 0.000 |
1.000 0.997 | 1.000 |
0.000 0.000 | 0.001 |
| 8 spectra, LNLLHR | 0.000 | 0.000 | 0.000 | 0.000 | 0.000 | 0.000 | 0.973 | 0.027 | ||
| 1 spectrum, GDNTISLMSIDSGSEIK | 0.000 | 0.269 | 0.000 | 0.043 | 0.000 | 0.000 | 0.687 | 0.000 | ||
| 2 spectra, ENFIWNLK | 0.000 | 0.000 | 0.000 | 0.000 | 0.000 | 0.000 | 1.000 | 0.000 | ||
| 1 spectrum, SQETTDDPVEYVLK | 0.000 | 0.000 | 0.000 | 0.000 | 0.000 | 0.000 | 1.000 | 0.000 | ||
| 2 spectra, MLTYLPGRPIAEVATSHQQLYEIGR | 0.000 | 0.000 | 0.000 | 0.000 | 0.000 | 0.000 | 0.930 | 0.070 | ||
| 3 spectra, ALEDFHHPK | 0.000 | 0.000 | 0.000 | 0.000 | 0.000 | 0.000 | 0.928 | 0.072 | ||
| 1 spectrum, ECINHGDLNDHNILVDLSK | 0.000 | 0.000 | 0.000 | 0.000 | 0.000 | 0.000 | 0.906 | 0.094 | ||
| 1 spectrum, EIVEQVIQLFK | 0.000 | 0.000 | 0.000 | 0.000 | 0.000 | 0.000 | 0.928 | 0.072 | ||
| 1 spectrum, NVPLLENYMGALSQSR | 0.000 | 0.000 | 0.088 | 0.282 | 0.180 | 0.000 | 0.451 | 0.000 | ||
| 2 spectra, HLQQMFDMGK | 0.000 | 0.248 | 0.000 | 0.000 | 0.061 | 0.000 | 0.691 | 0.000 | ||
| 4 spectra, AAGFPTASVCR | 0.000 | 0.000 | 0.000 | 0.000 | 0.000 | 0.000 | 0.933 | 0.067 | ||
| 4 spectra, AVEEIWFETAK | 0.000 | 0.000 | 0.000 | 0.000 | 0.000 | 0.000 | 0.951 | 0.049 | ||
| 2 spectra, SSQTPDLIEMQNHIIMFLR | 0.000 | 0.000 | 0.000 | 0.000 | 0.000 | 0.000 | 1.000 | 0.000 |
| Plot | Mito | Lyso or Perox | ER | Golgi | PM | Cytosol | Nucleus | ||||||
| Expt B |
7 peptides |
19 spectra |
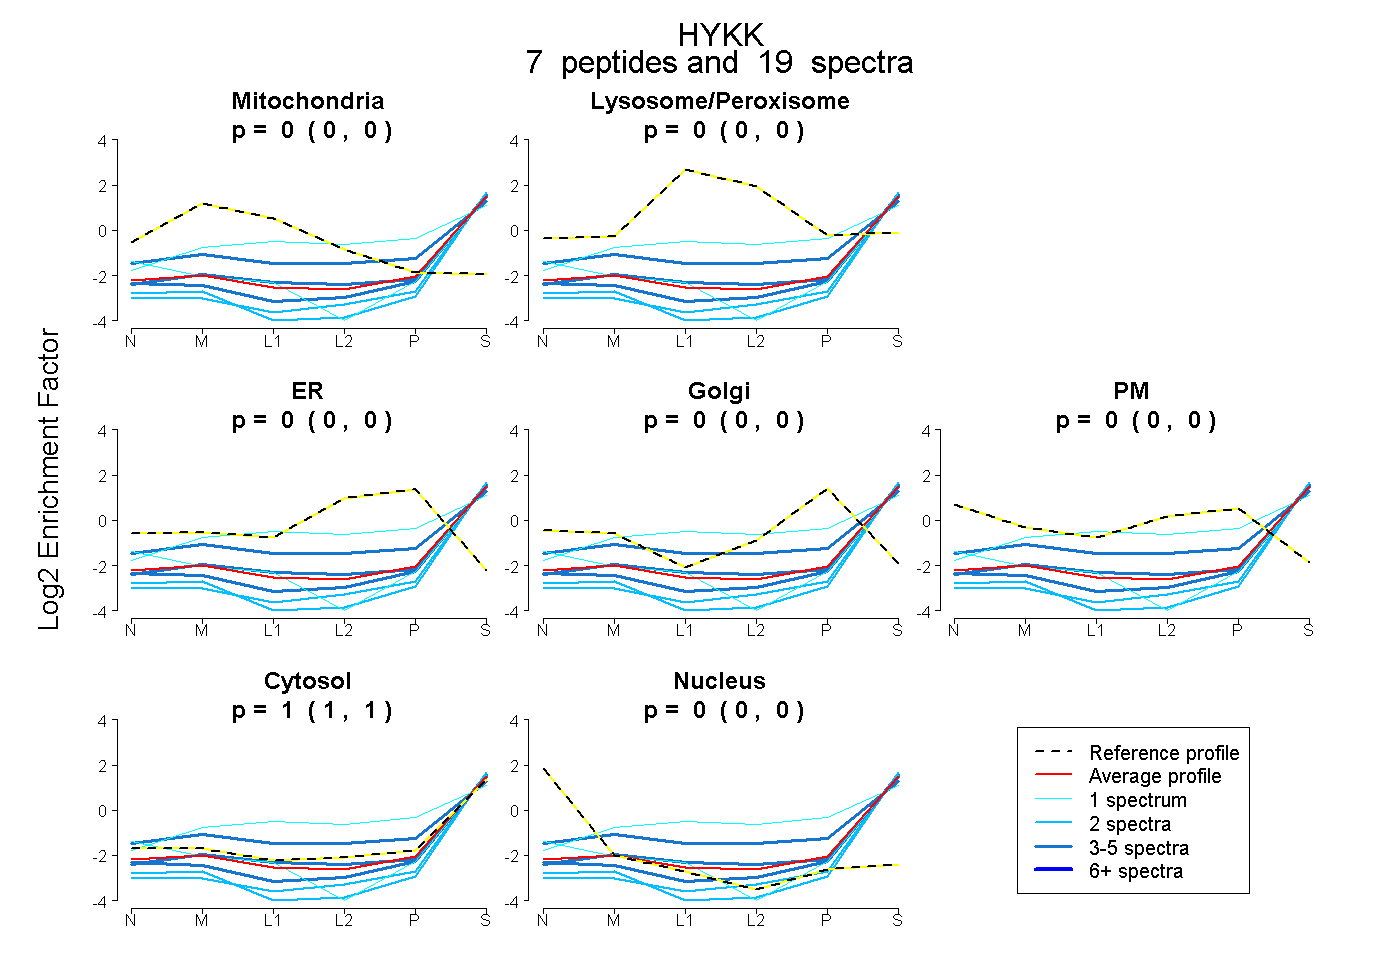 |
0.000 0.000 | 0.000 |
0.000 0.000 | 0.000 |
0.000 0.000 | 0.000 |
0.000 0.000 | 0.000 |
0.000 0.000 | 0.000 |
1.000 1.000 | 1.000 |
0.000 0.000 | 0.000 |
|||
| Plot | Lyso | Other | |||||||||||
| Expt C |
6 peptides |
16 spectra |
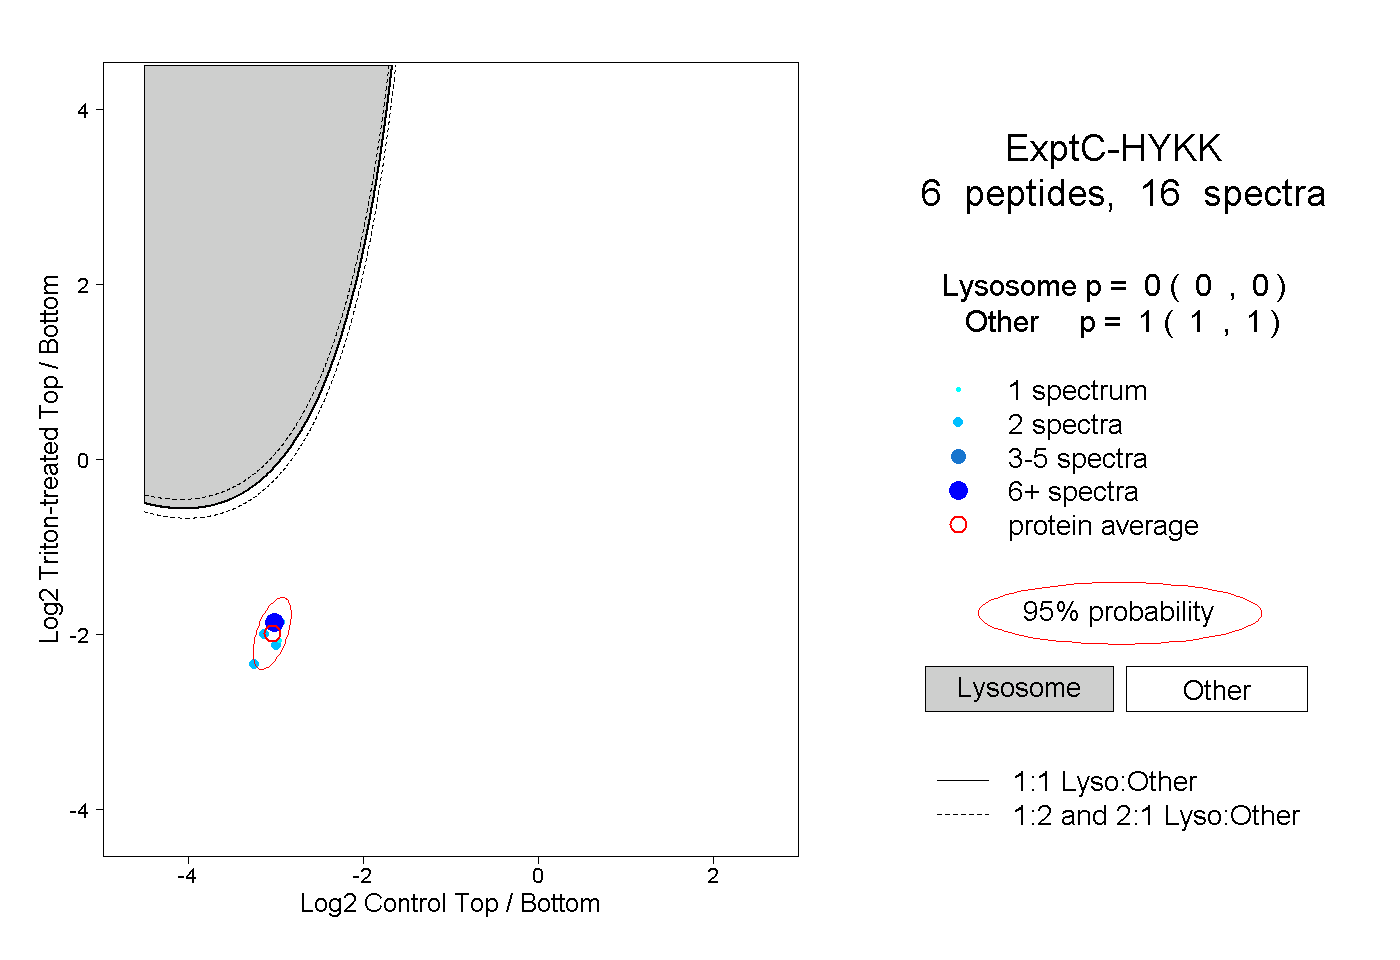 |
0.000 0.000 | 0.000 |
1.000 1.000 | 1.000 |
||||||||
| Plot | Lyso | Other | |||||||||||
| Expt D |
1 peptide |
1 spectrum |
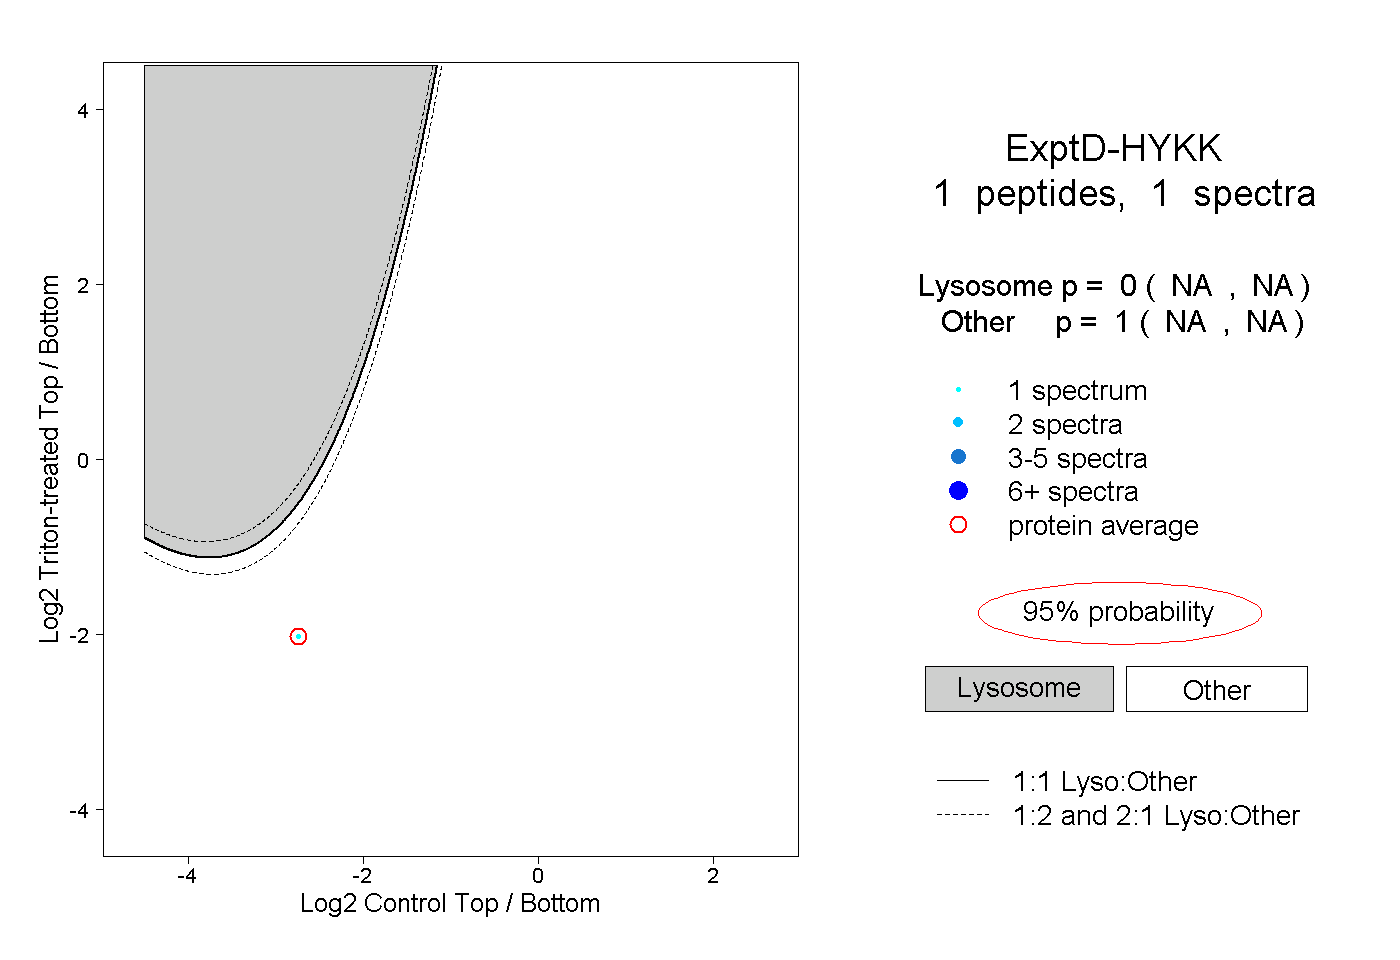 |
0.000 NA | NA |
1.000 NA | NA |