7
7peptides
spectra
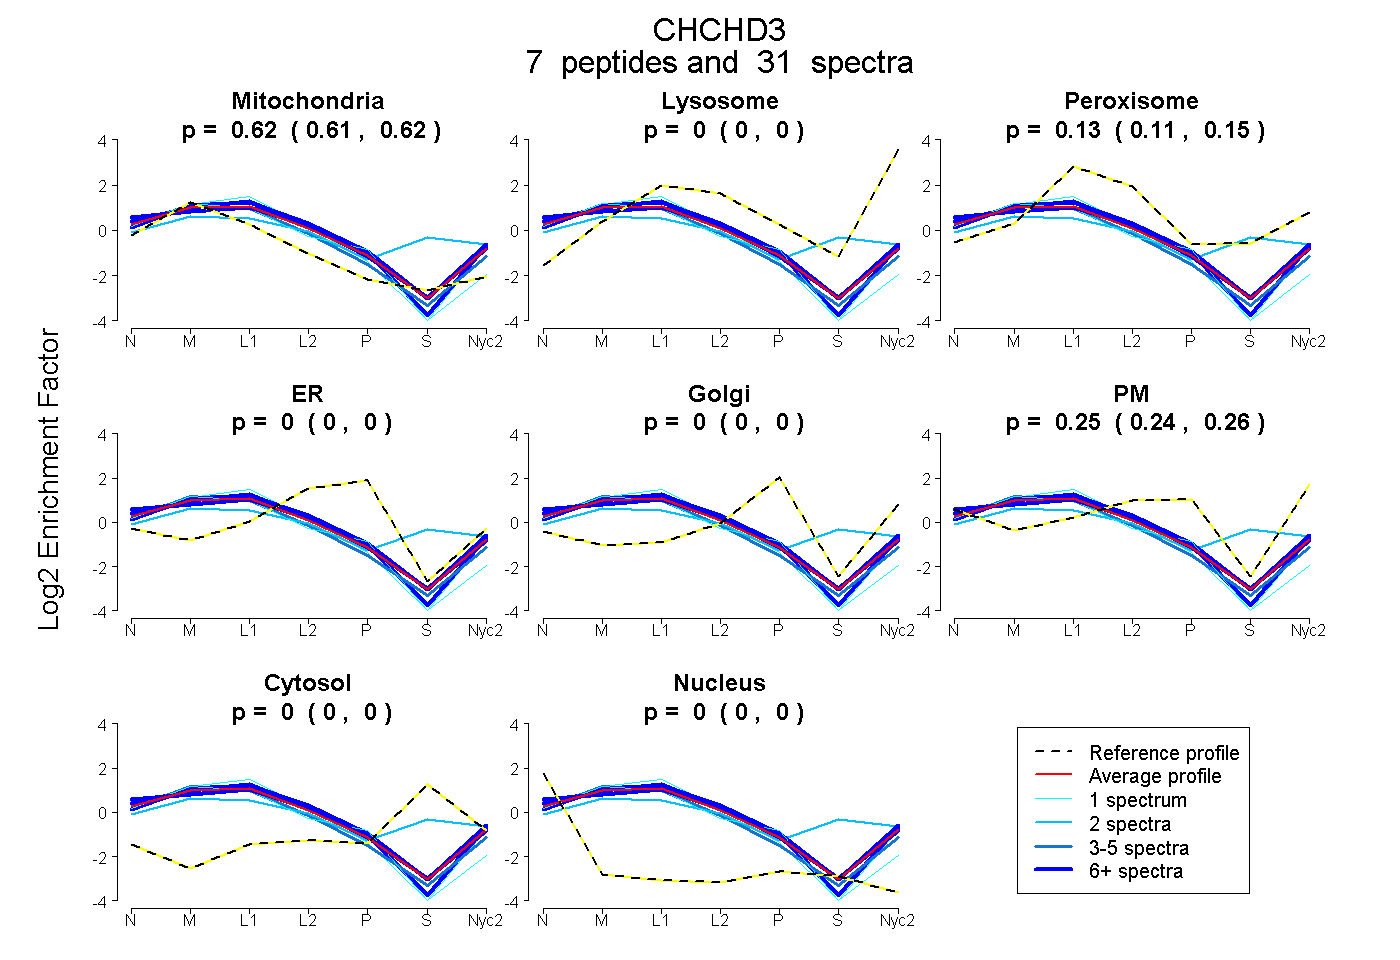
0.608 | 0.625
0.000 | 0.000
0.110 | 0.150
0.000 | 0.004
0.000 | 0.000
0.235 | 0.264
0.000 | 0.000
0.000 | 0.000
8peptides
spectra
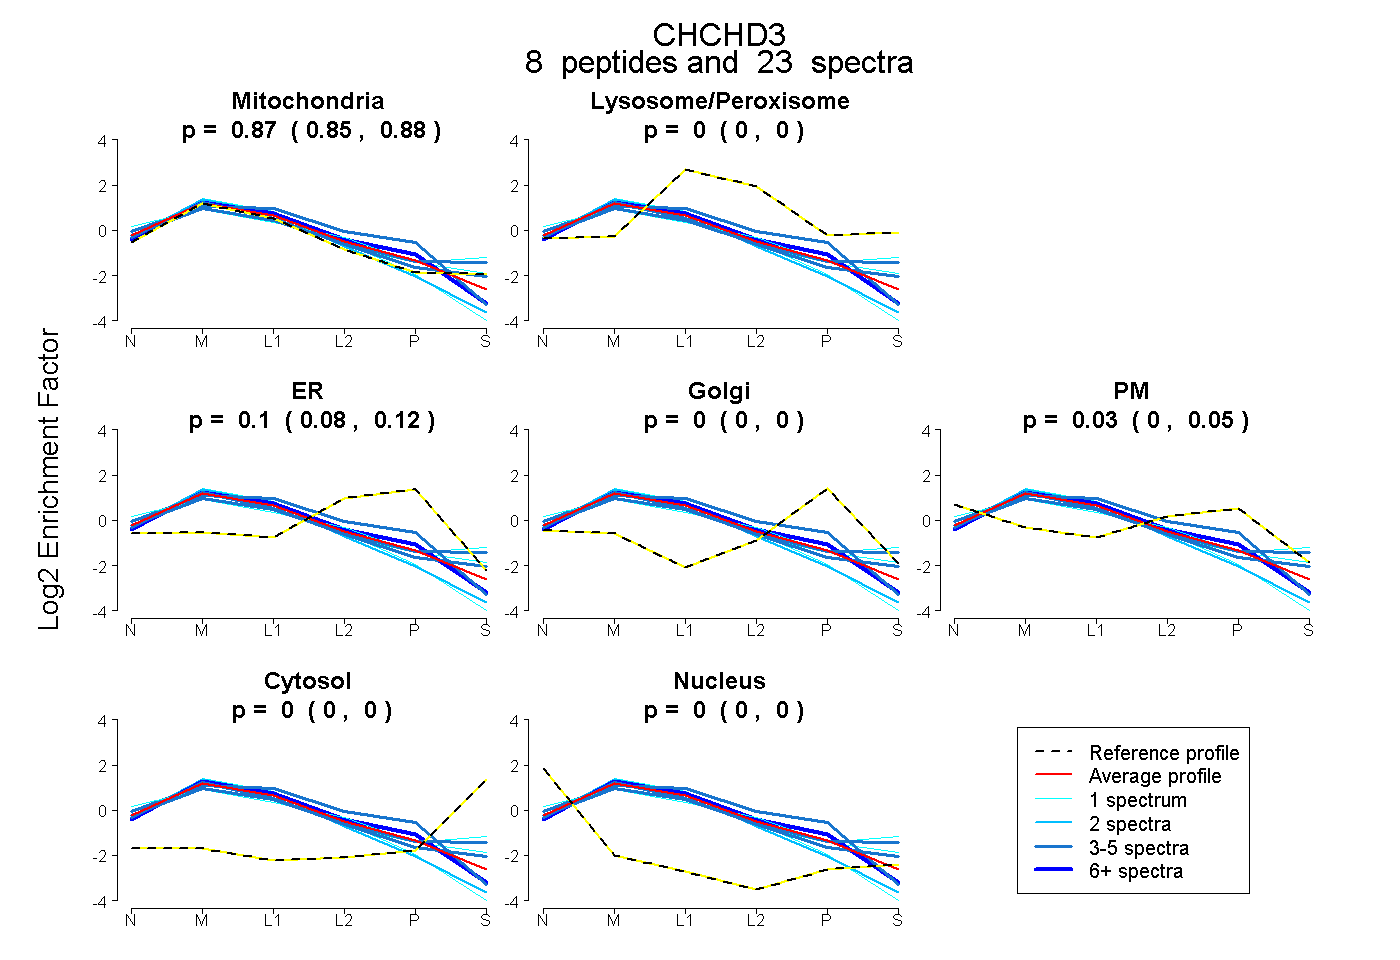
0.851 | 0.880
0.000 | 0.000
0.077 | 0.124
0.000 | 0.000
0.004 | 0.051
0.000 | 0.000
0.000 | 0.000
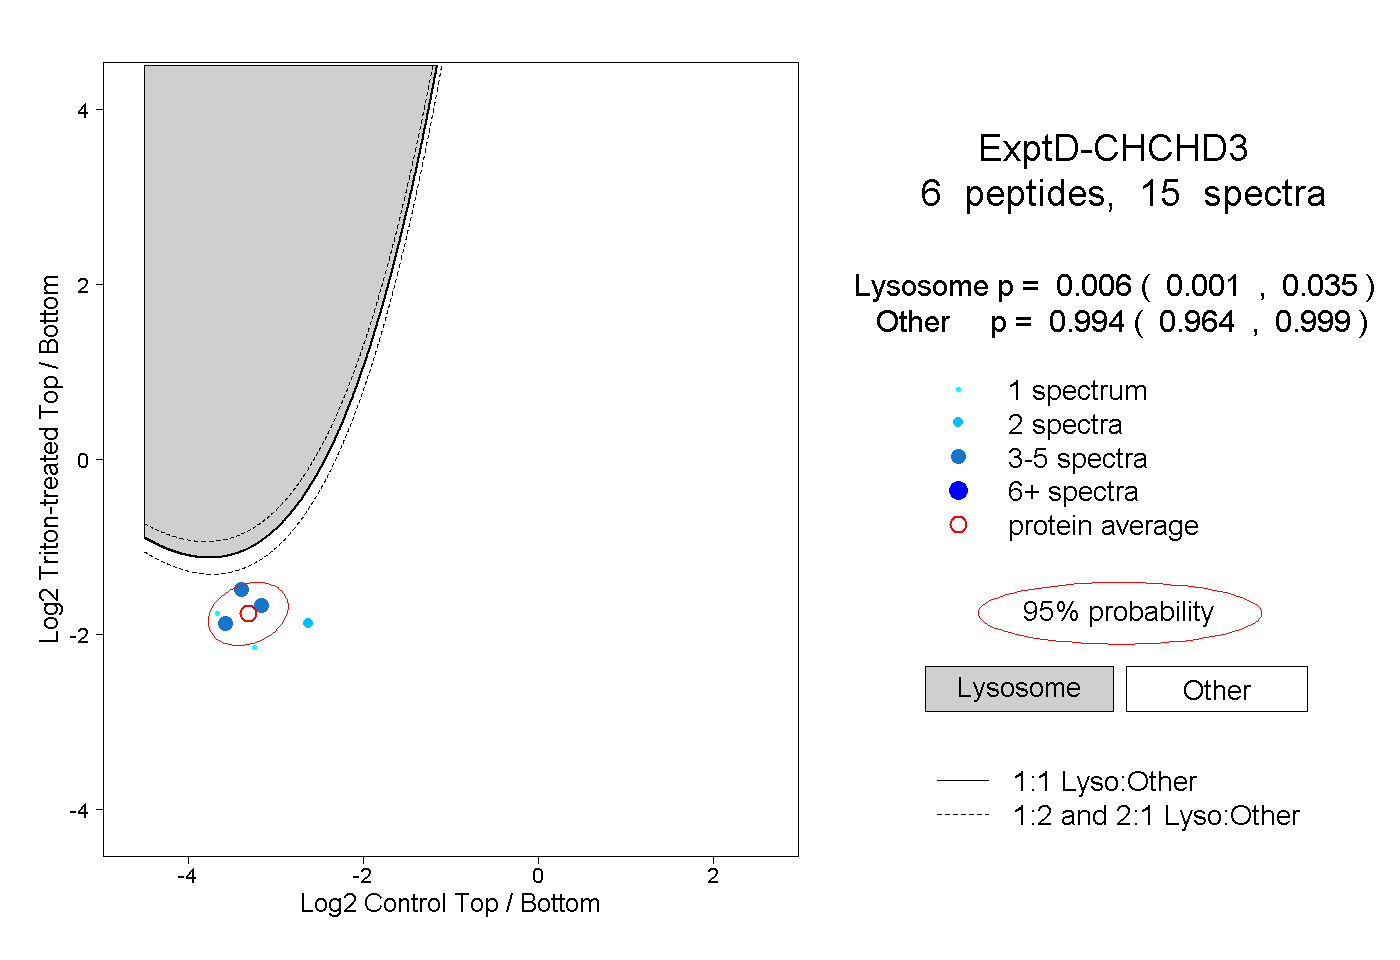
15peptides
spectra
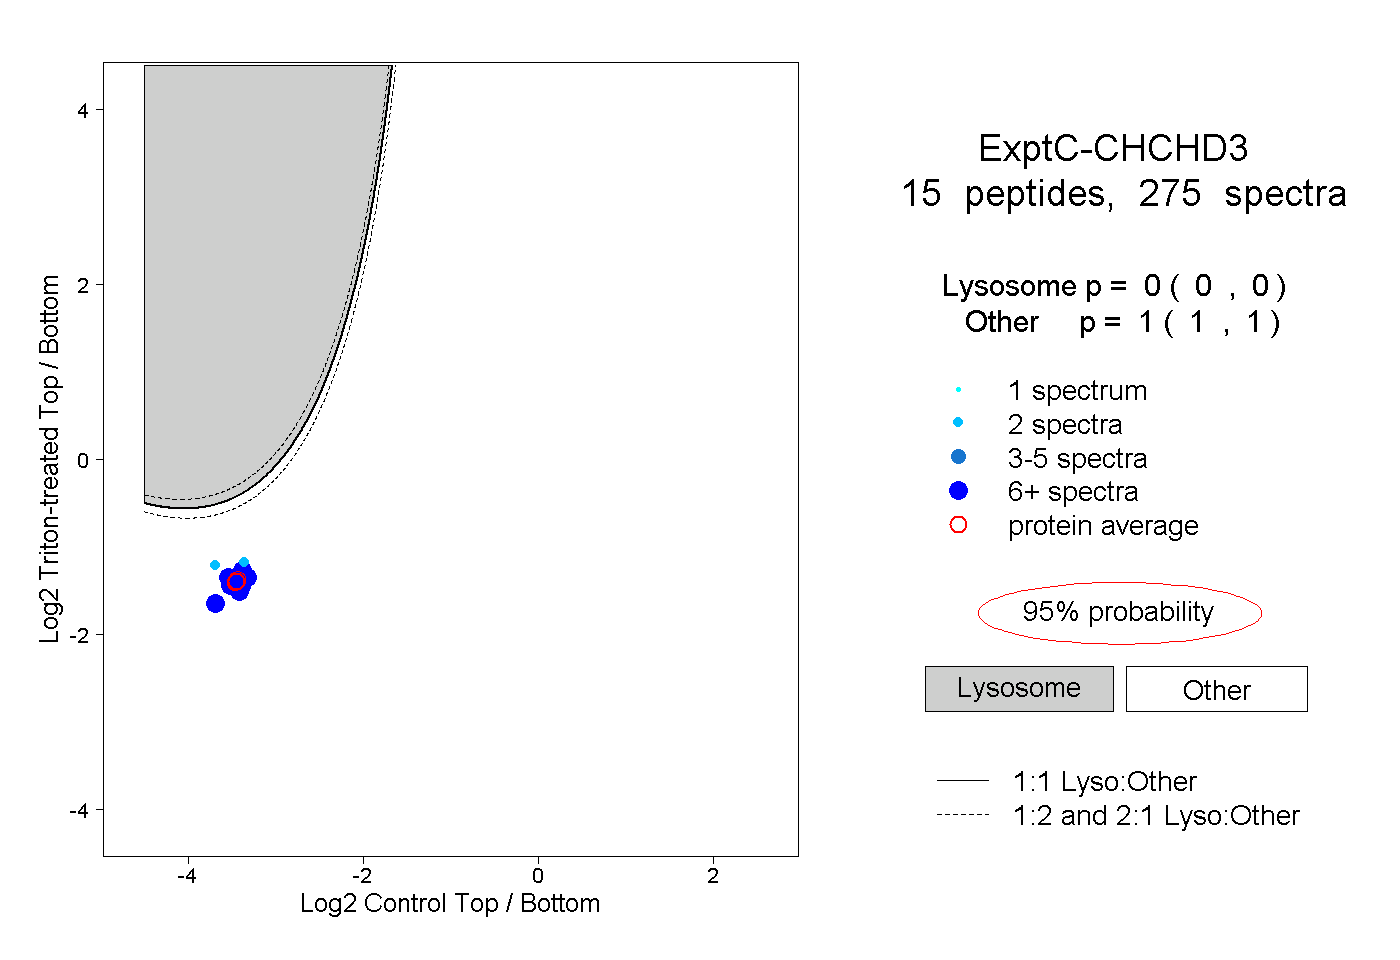
0.000 | 0.000
1.000 | 1.000